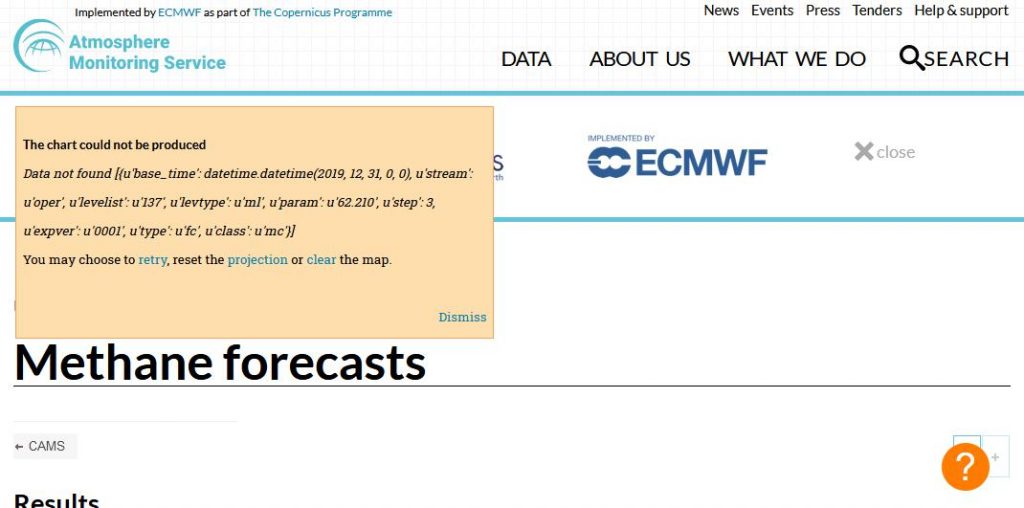
01/01/20 – Methane Report for CAMS Data for Tuesday, 12/31/19
1/1/20 – from Robin Westenra: The latest from the Australian bushfires
‘Apocalyptic’: New Zealand shrouded in smoke from Australian bushfires
http://robinwestenra.blogspot.com/2020/01/the-latest-from-australian-bushfires.html
1/2/20 – Psalms Chapters 66 – 70
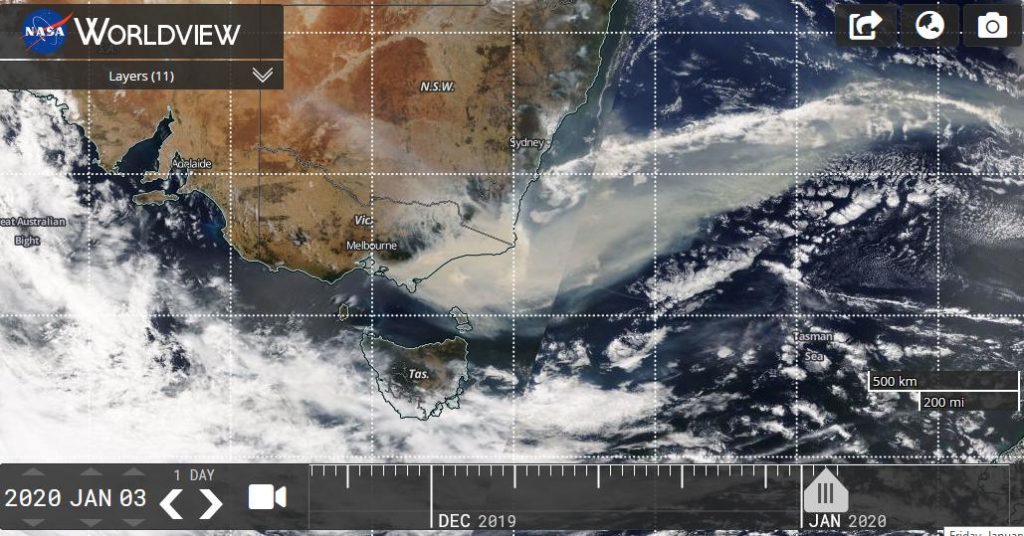
1/3/20 – Australian wildfires smoke from NASA Worldview
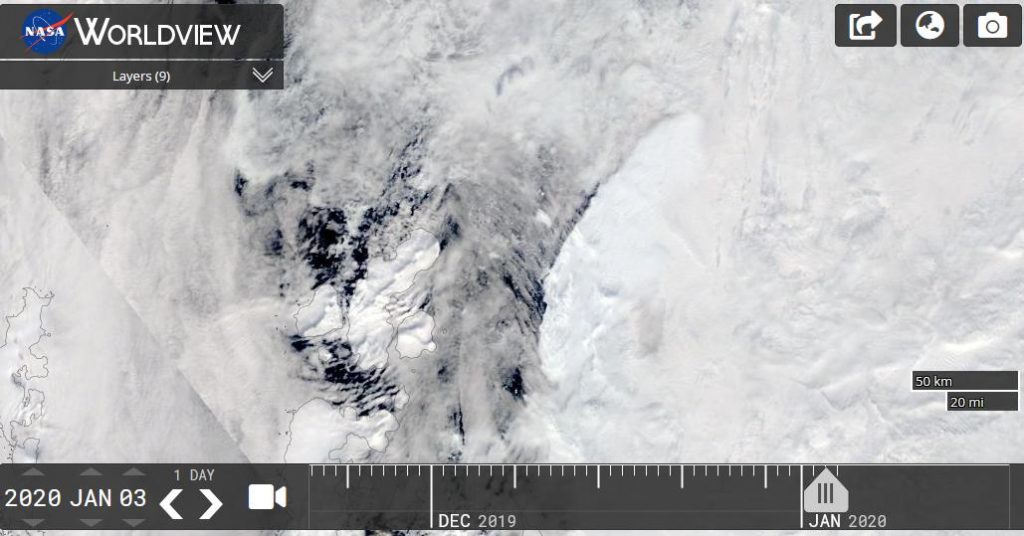
1/3/20 – Iceberg A-68 is moving more
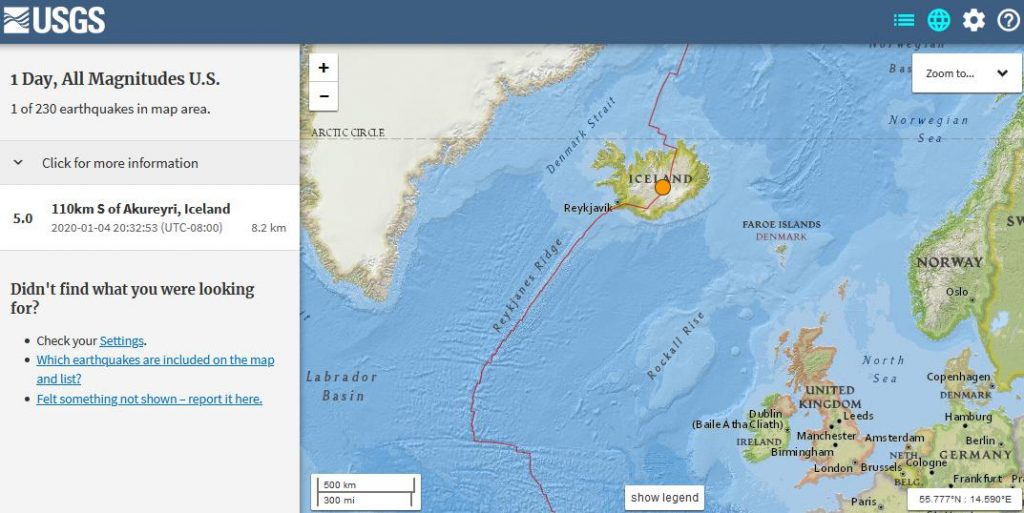
1/5/20 – Iceland Earthquake!
M 5.0 – 110km S of Akureyri, Iceland
-2020-01-05 04:32:53 (UTC)
-64.701°N 17.752°W
-8.2 km depth
1/6/20 – Methane, Sea Ice & Climate Update with Margo (Jan. 6, 2020)
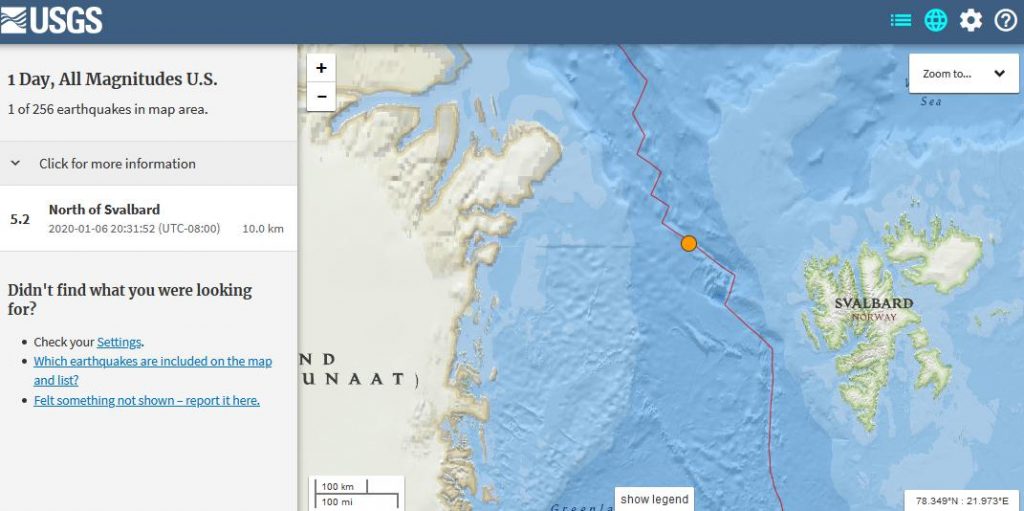
1/7/20 – Another Large Arctic Earthquake
M 5.2 – North of Svalbard
-2020-01-07 04:31:52 (UTC)
-80.043°N 0.157°E
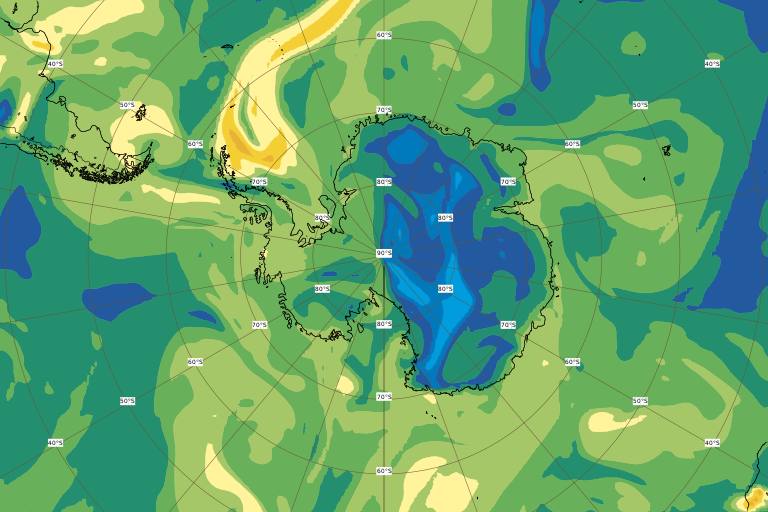
1/7/20 – Unusual Antarctic Sulfur Dioxide Release & Various Updates (Jan. 7, 2020)
Margo looks at an unusual release of sulfur dioxide from the Antarctic on CAMS, Climate Reanalyzer, NASA Worldview, Earthquakes and Space Weather. Margo also reads Isaiah Chapter 24.
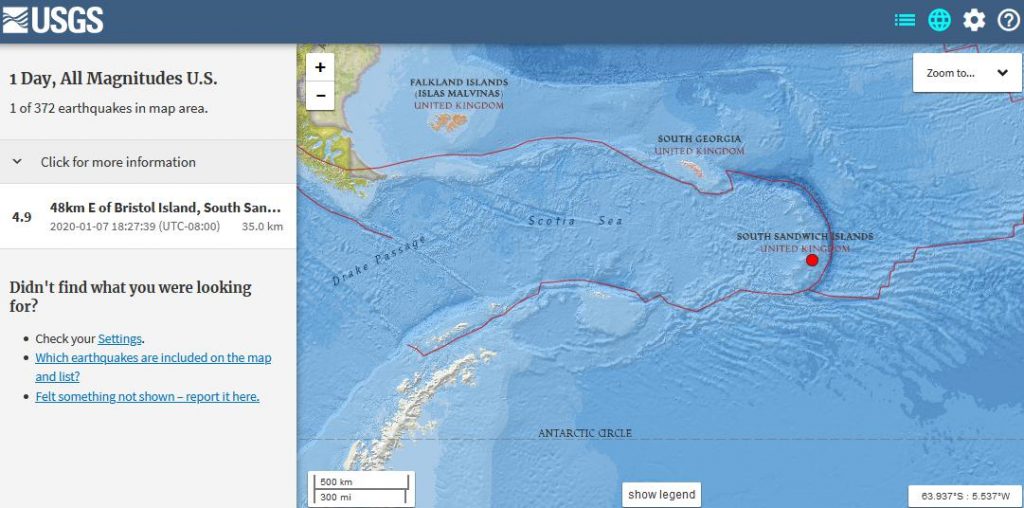
1/7/20 – 4.9 M Earthquake in the South Atlantic – could this be related to the sulfur dioxide release we saw in Antarctica earlier today?
M 4.9 – 48km E of Bristol Island, South Sandwich Islands
-2020-01-08 02:27:39 (UTC)
-59.042°S 25.666°W
-35.0 km depth
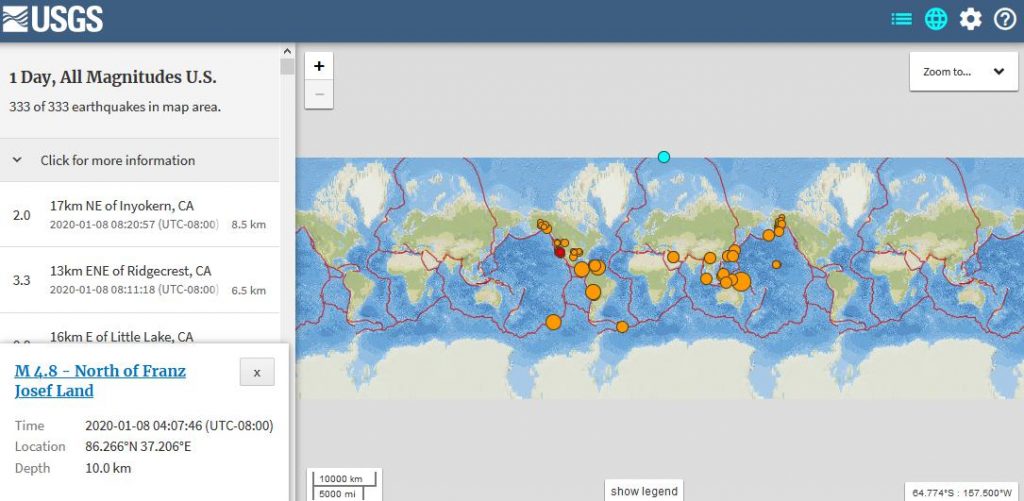
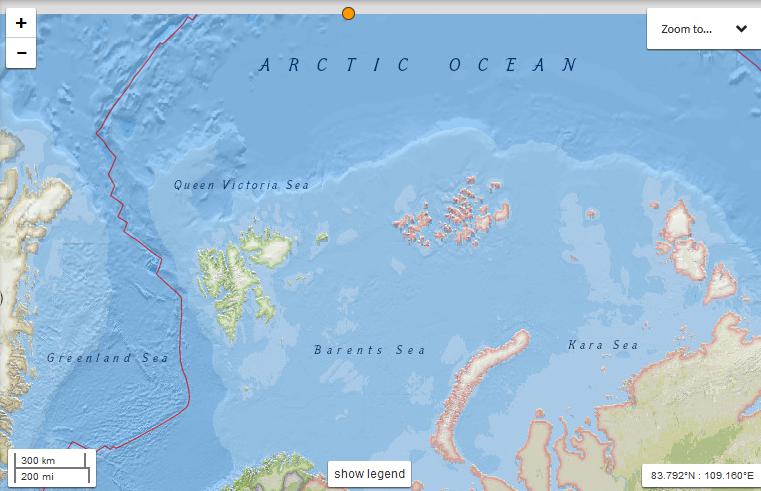
1/8/20 – Another Arctic Earthquake – Near the North Pole this time
M 4.8 – North of Franz Josef Land
-2020-01-08 12:07:46 (UTC)
-86.266°N 37.206°E
1/8/20 – No new methane data yet on CAMS!
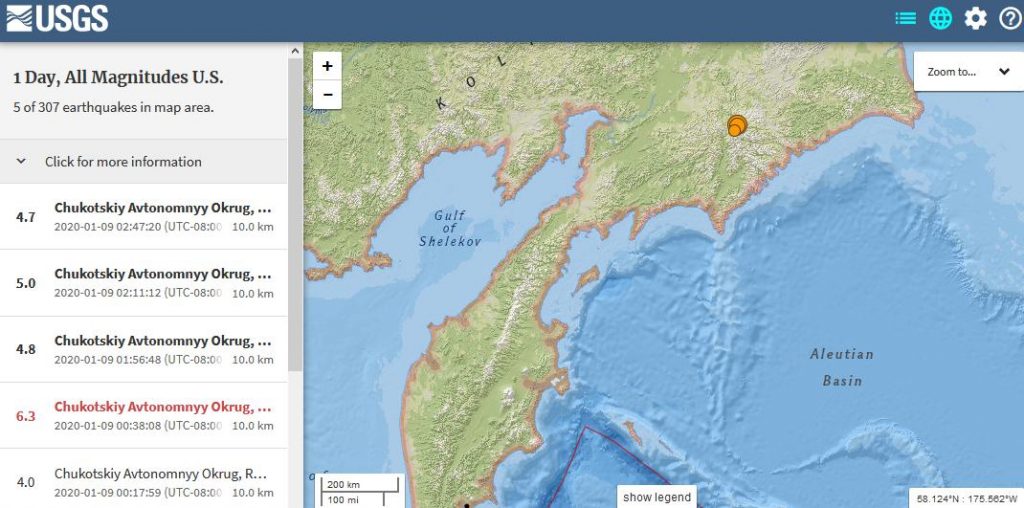
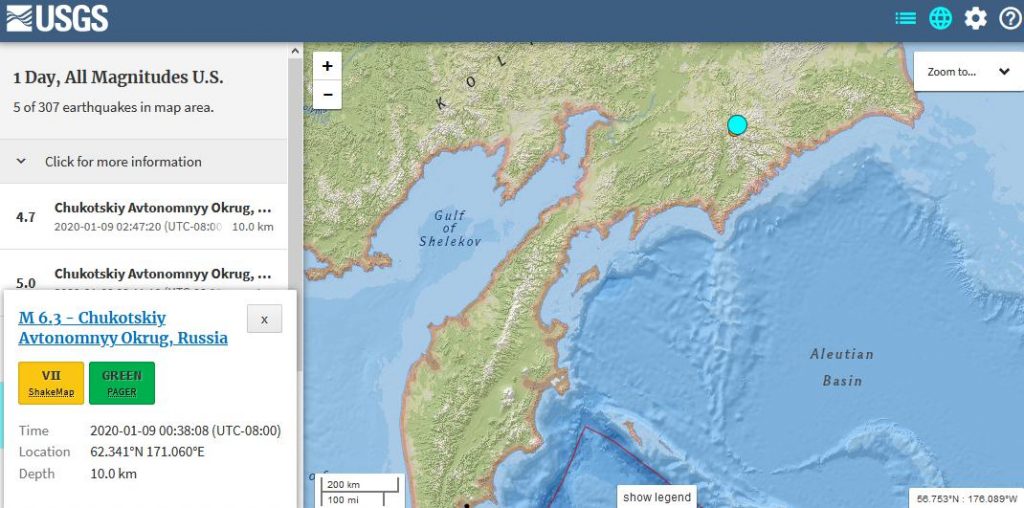
1/9/20 – More large Arctic earthquakes – cluster of 5 so far in Russia
M 6.3 – Chukotskiy Avtonomnyy Okrug, Russia
-2020-01-09 08:38:08 (UTC)
-62.341°N 171.060°E
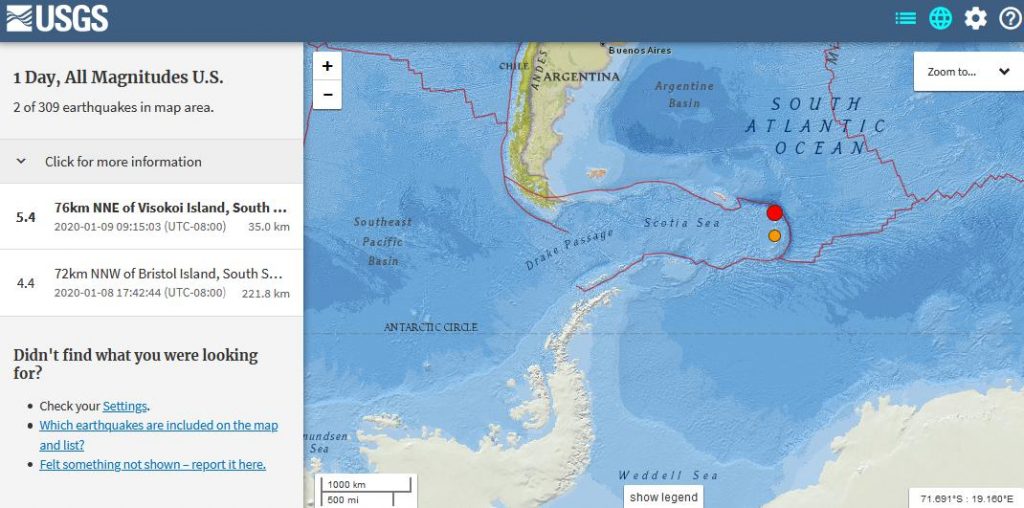
1/9/20 – 2 more EQ’s in the S. Atlantic near the Antarctic sulfur dioxide release
M 5.4 – 76km NNE of Visokoi Island, South Georgia and the South Sandwich Islands
-2020-01-09 17:15:03 (UTC)
-56.064°S 26.722°W
-35.0 km depth
1/9/20 – I’ve opened a support ticket in CAMS regarding the missing methane and carbon dioxide data. We’ll see how long it takes for them to get the data up. The last time I did this, they reconfigured all the color ledgers for methane.
1/9/20 – I’ve received a response from CAMS support:
Hi Margo,
Thank you for your message. Indeed, we became aware of the issue with the charts update yesterday. We hope to have the CO2 and CH4 charts available again in the next few days. Apologies for the inconvenience this is causing in the meantime.
Kind Regards,
Kevin
C3S/CAMS User Support
1/11/20 – There’s STILL no methane or carbon dioxide data on CAMS!
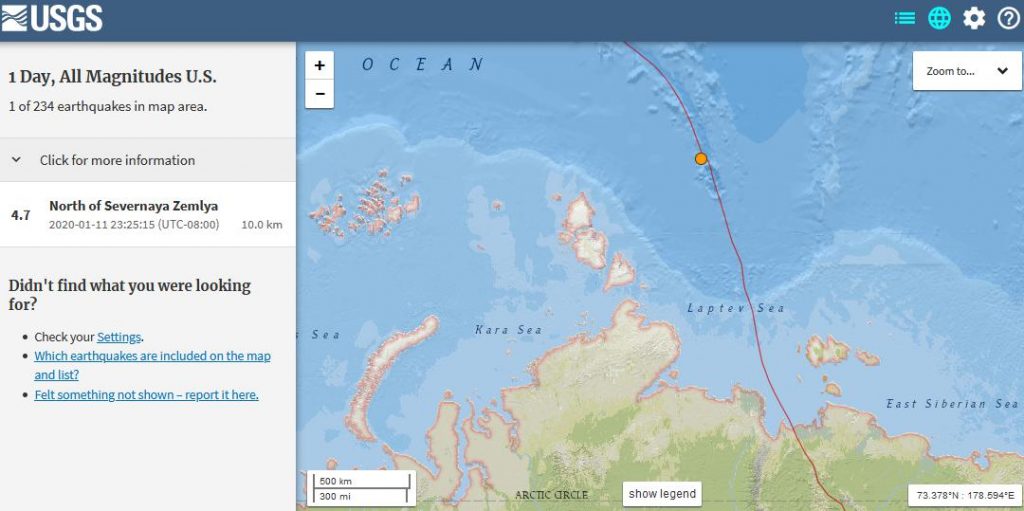
1/12/20 – Another Arctic Earthquake!
M 4.7 – North of Severnaya Zemlya
-2020-01-12 07:25:15 (UTC)
-82.143°N 117.840°E
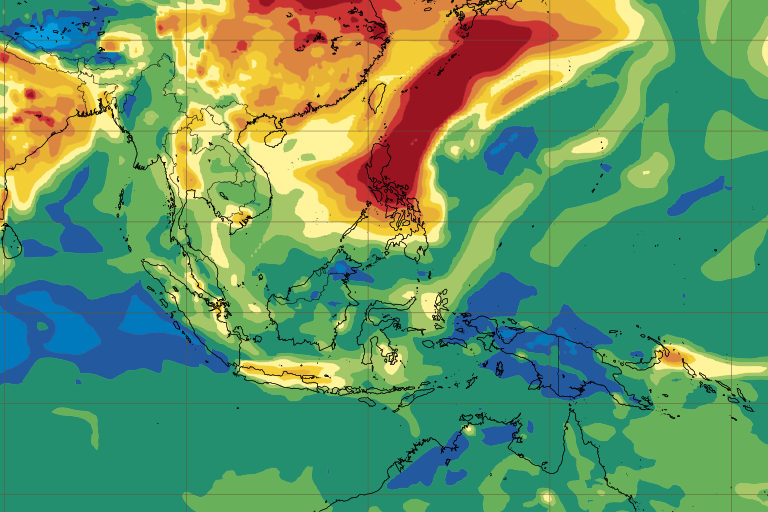
1/13/20 – Huge Sulfur Dioxide release from the TAAL Volcano!
source: CAMS SO2 1/13/20 – Southeast Asia & Indonesia View
1/13/20 – Sulfur Dioxide, Methane & Climate Update with Margo (Jan. 13, 2020)
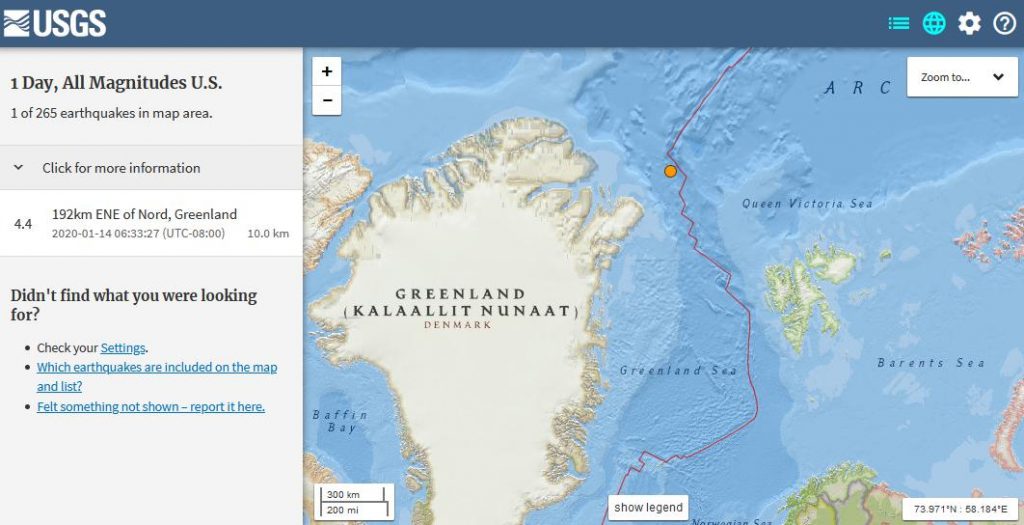
1/14/20 – Arctic Earthquake off the coast of Greenland
M 4.4 – 192km ENE of Nord, Greenland
-2020-01-14 14:33:27 (UTC)
-82.460°N 6.486°W
1/14/20 – Methane Report for CAMS Data for Sunday, 1/5/20
CAMS just released this data. I’ll follow up with commentary soon.
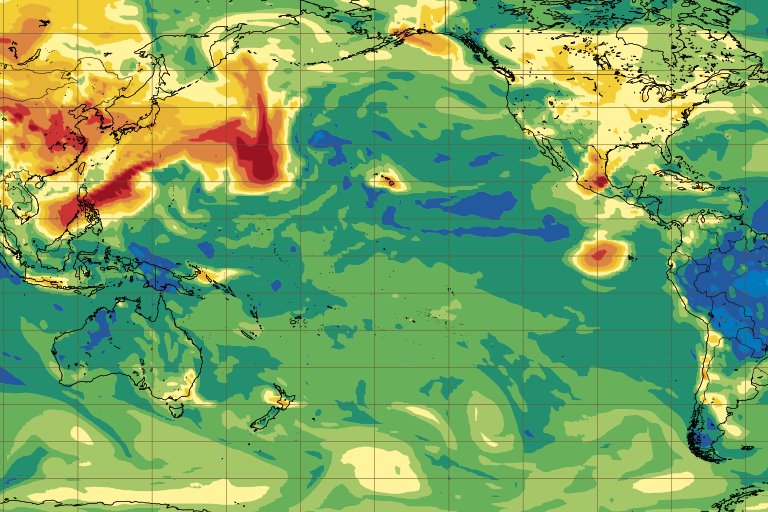
1/14/20 – Sulfur Dioxide over the Pacific today
source: CAMS SO2 total column Pacific View
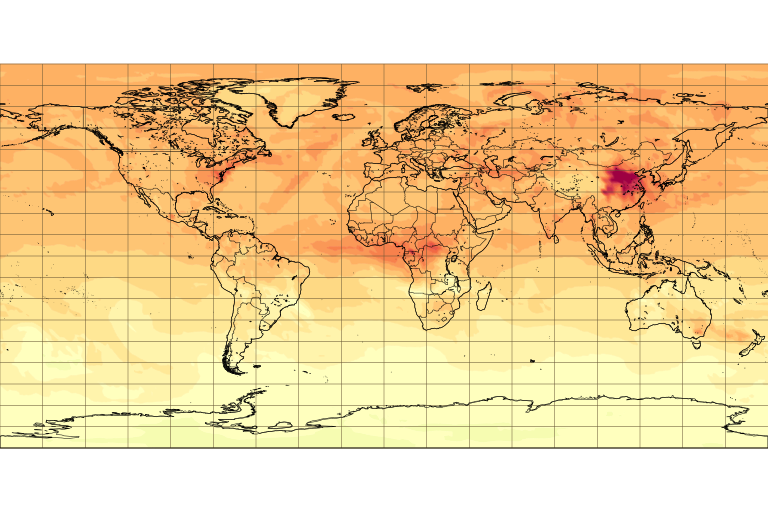
1/14/20 – Carbon Dioxide global view for 1/5/20
source: CAMS CO2 Total Column Global View
1/14/20 – Methane Report for CAMS Data for Tuesday, 1/7/20
CAMS updating skipped Monday, 1/6/20.
1/15/20 – Analysis of New Methane & Carbon Dioxide Data on CAMS (Jan. 15, 2020)
After almost 2 weeks of no new data for methane and carbon dioxide, CAMS has started releasing this data for 2020. Margo looks at the new data and compares it to her previous recordings of CAMS images. She notes a considerable difference in the colors on the maps compared to what was seen before the lapse. Additionally, so far there is missing data for Jan. 1-4 and Jan. 6, 2020.
1/15/20 – Methane Report for CAMS Data for Wednesday, 1/8/20
1/15/20 – Analysis of New Methane & Carbon Dioxide Data on CAMS with Margo (Jan. 15, 2020)
After almost 2 weeks of no new data, CAMS has started releasing new methane and carbon dioxide data for 2020. Margo looks at the new data and compares it to her previous recordings of CAMS images. She notes a considerable difference in the colors on the maps compared to what was seen before the lapse. Additionally, so far there is missing data for Jan. 1-4 and Jan. 6, 2020.
1/15/20 – from Robin Westenra: URGENT – What is happening to the methane data: IS THERE A METHANE EVENT UNDERWAY?
https://robinwestenra.blogspot.com/2020/01/urgent-what-is-happening-to-methane-data.html
1/15/20 – Methane Report for CAMS Data for Thursday, 1/9/20
1/16/20 – More on the methane from Robin Westenra:
More on Copernicus’ greenhouse data fraud – ALERT: Copernicus are manipulating data to cover up the true situation?
http://robinwestenra.blogspot.com/2020/01/more-on-copernicus-greenhouse-data-fraud.html
Thanks Robin for helping to get this information out!
1/16/20 – Methane Report for CAMS Data for Saturday, 1/11/20
Data for Friday, 1/10/20 is missing.
1/16/20 – Methane Report for CAMS Data for Sunday, 1/12/20
1/17/20 – Methane Report for CAMS Data for Monday, 1/13/20
1/17/20 – Methane Report for CAMS Data for Tuesday, 1/14/20
1/17/20 – Methane Report for CAMS Data for Wednesday, 1/15/20
1/17/20 – Methane Report for CAMS Data for Thursday, 1/16/20
This makes CAMS caught up. Hopefully they will update daily now for a while. NOTE: The colors still look altered to me.
1/18/20 – Methane Report for CAMS Data for Friday, 1/17/20
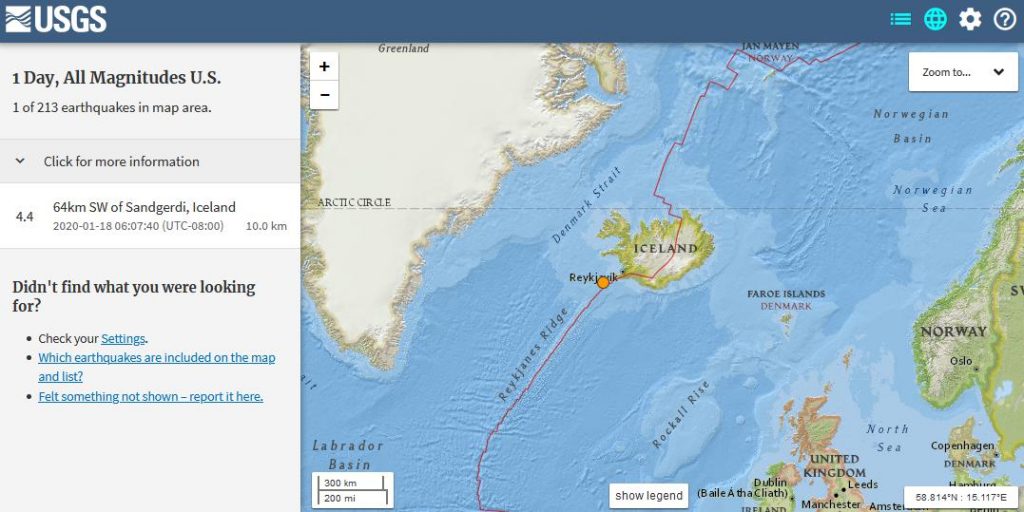
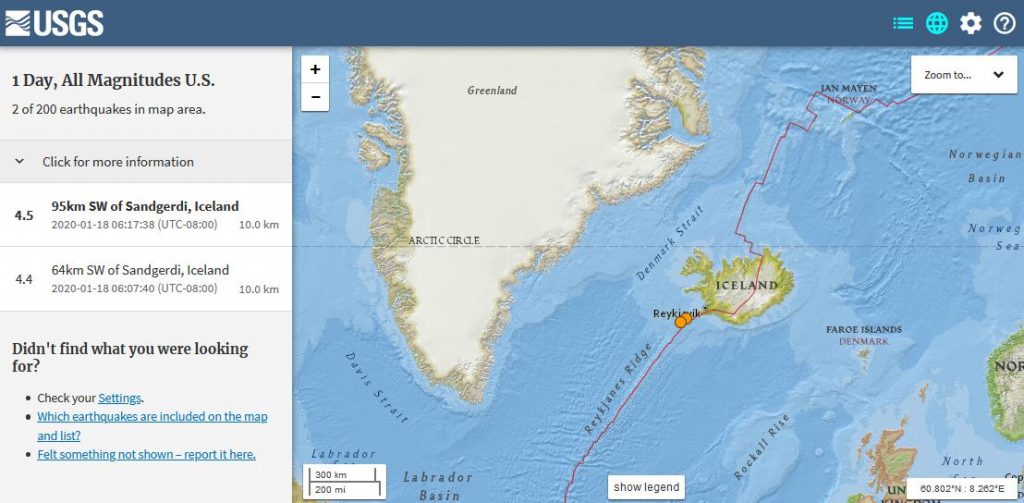
1/18/20 – Another Iceland Earthquake
M 4.4 – 64km SW of Sandgerdi, Iceland
-2020-01-18 14:07:40 (UTC)
-63.676°N 23.743°W
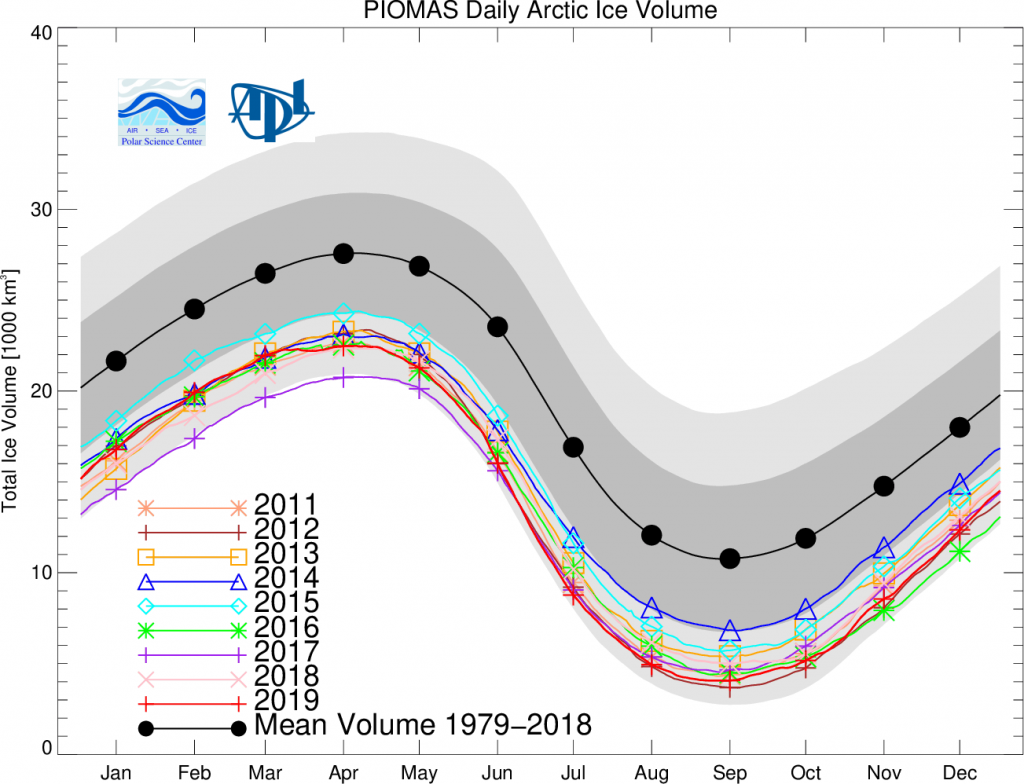
1/18/20 – PIOMAS Arctic Sea Ice Volume Reanalysis
Annual Update
2019 finished with an annually averaged sea ice volume that was the 2nd lowest on record with 13,500 km 3 , about 600 km 3 above the 2017 record with very similar volume numbers for recent low annual volume years (2011, 2012, 2016, 2017).
http://psc.apl.uw.edu/research/projects/arctic-sea-ice-volume-anomaly/
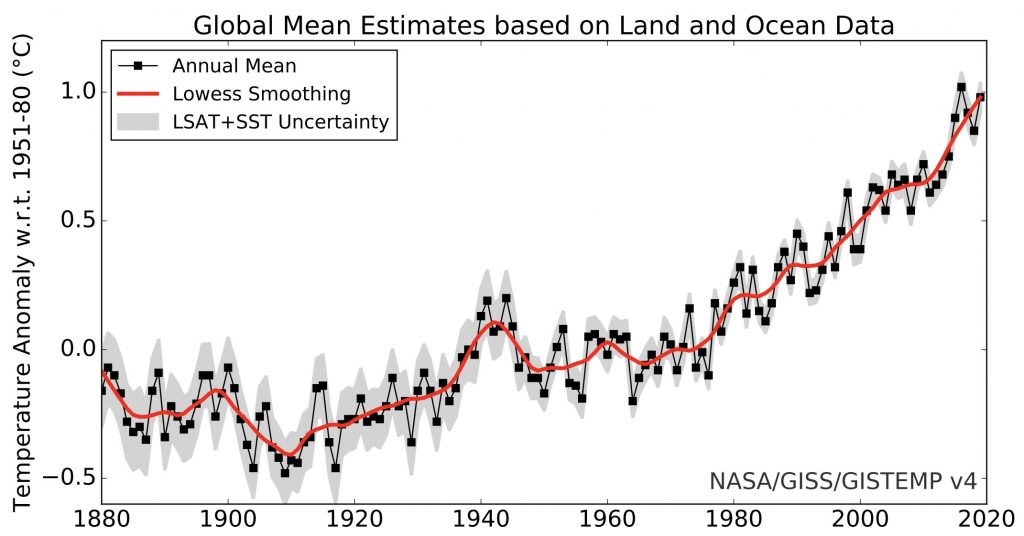
1/18/20 – from Zack Labe: 2019 was the 2nd warmest year on record (since at least 1880)
https://twitter.com/ZLabe/status/1217800538970099712
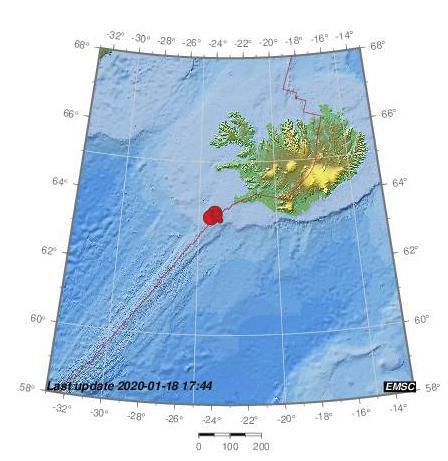
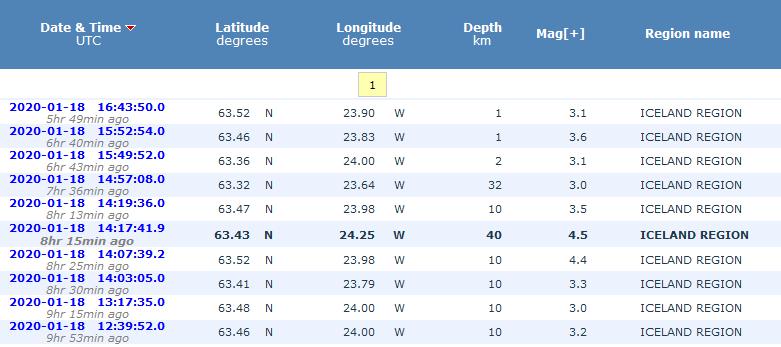
1/18/20 – 10 Iceland Earthquakes so far today!
source: EMSC
1/18/20 – USGS Shows 2 Iceland Earthquakes today
1/19/20 – Methane Report for CAMS Data for Saturday, 1/18/20
1/19/20 – Methane Report for CAMS Data for Sunday, 1/19/20
1/19/20 – Methane Update with Margo (Jan. 19, 2020)
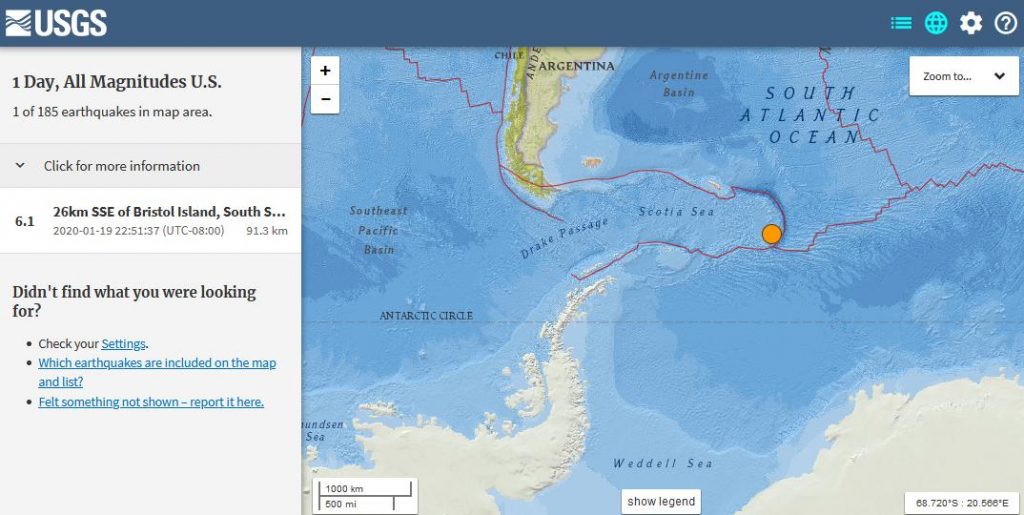
1/20/20 – Large Earthquake in the S. Atlantic
M 6.1 – 26km SSE of Bristol Island, South Sandwich Islands
-2020-01-20 06:51:37 (UTC)
-59.234°S 26.275°W
-91.3 km depth
1/20/20 – Methane Report for CAMS Data for Monday, 1/20/20
01/21/20 – The Navy website is back up! Here’s Arctic sea ice thickness for today:
1/21/20 – Methane Report for CAMS Data for Tuesday, 1/21/20
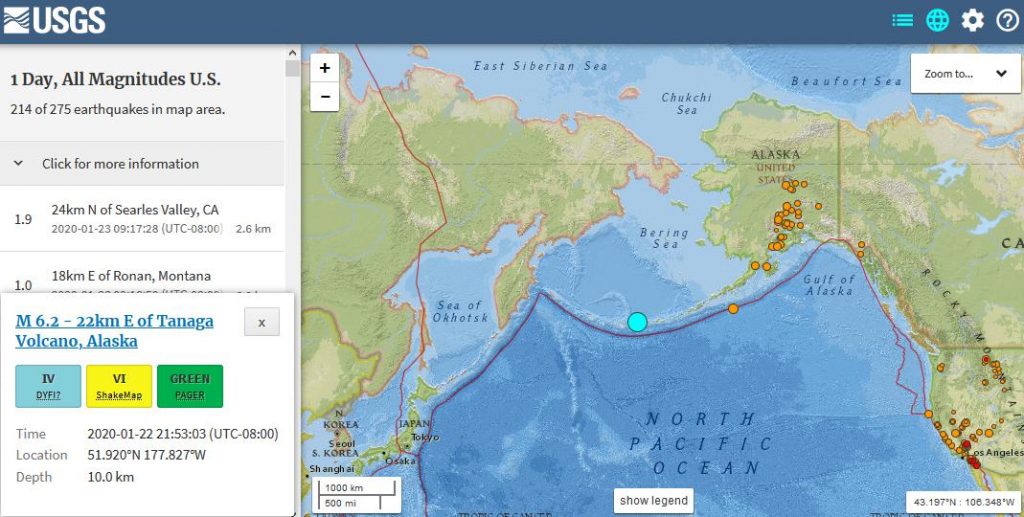
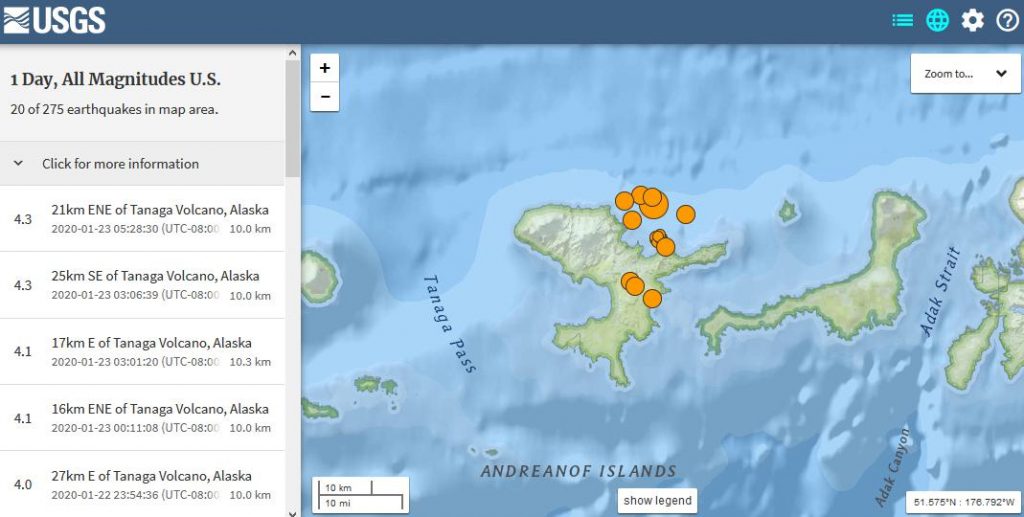
1/23/20 – Large 6.2 M Earthquake in the Aleutian Islands – Tanaga Volcano Island – Swarm of 20 so far today
M 6.2 – 22km E of Tanaga Volcano, Alaska
-2020-01-23 05:53:03 (UTC)
-51.920°N 177.827°W
1/23/20 – Here’s the Navy’s 30 day animation for Arctic Sea Ice Thickness (Jan. 1-30, 2020)
I’ll be doing a complete sea ice update shortly.
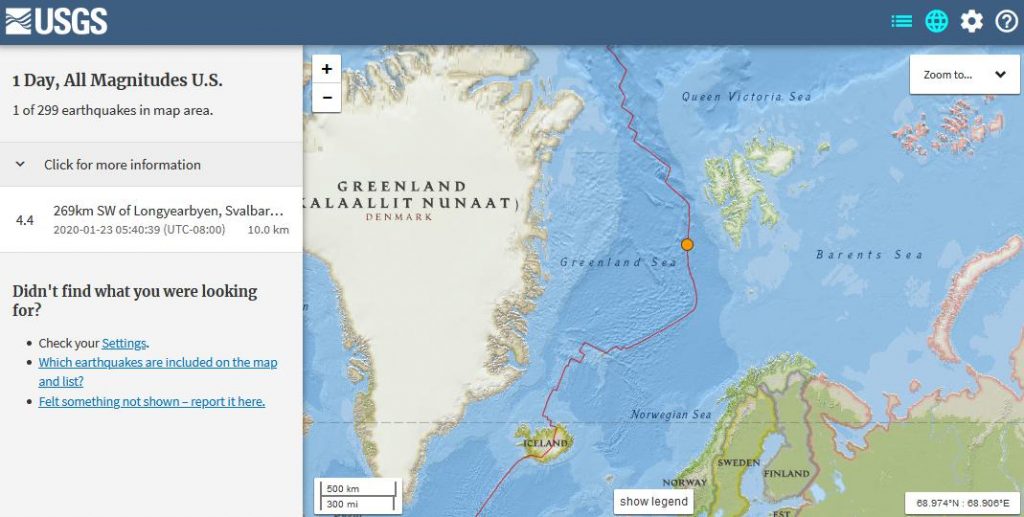
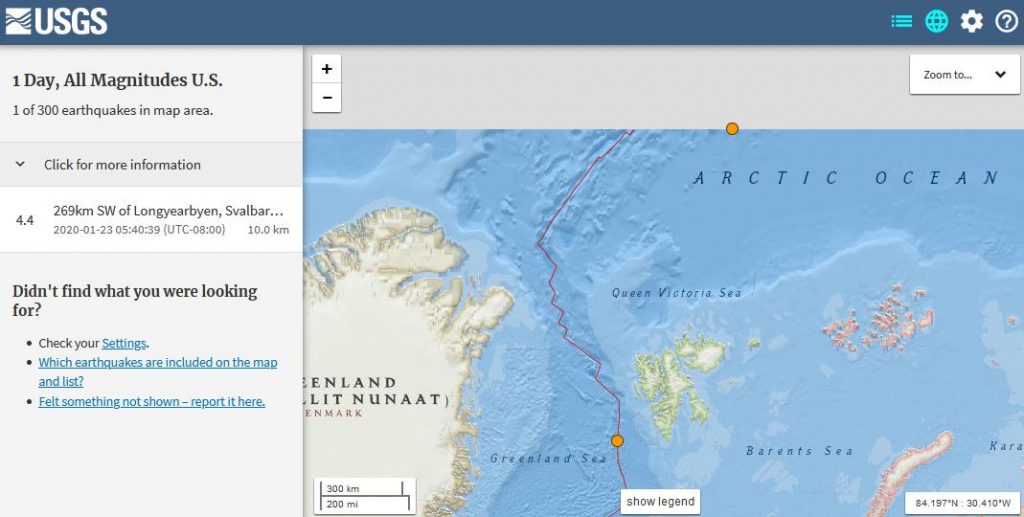
1/23/20 – 2 Arctic Earthquakes near Svalbard!
M 4.4 – 269km SW of Longyearbyen, Svalbard and Jan Mayen
-2020-01-23 13:40:39 (UTC)
-76.578°N 7.518°E
M 4.7 – North of Svalbard
-2020-01-23 18:50:05 (UTC)
-85.988°N 28.618°E
1/23/20 – Sea Ice Update with Margo (Jan. 23, 2020)
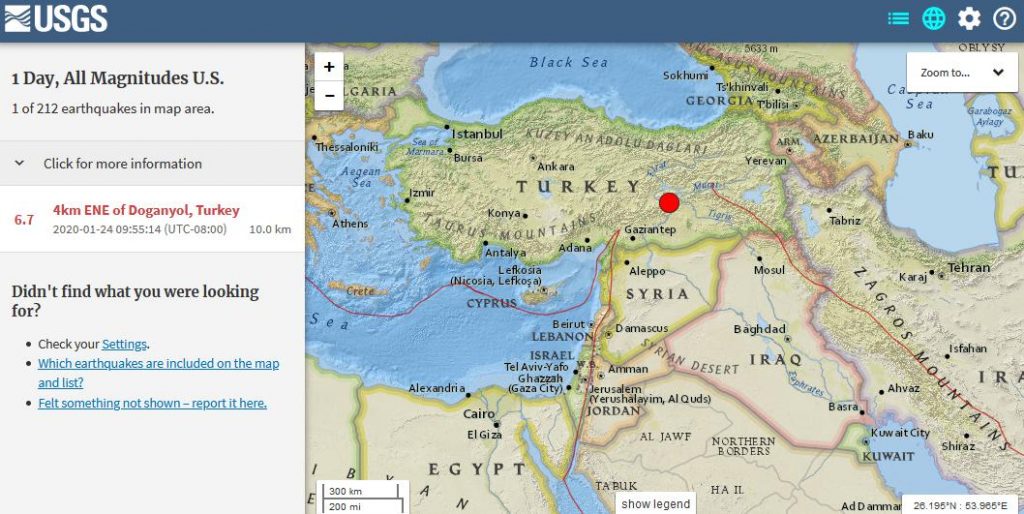
1/24/20 – 6.9 M Earthquake just hit Turkey! USGS downgraded to 6.7 M
equivalent to 14.9 atomic bombs!
M 6.7 – 4km ENE of Doganyol, Turkey
-2020-01-24 17:55:14 (UTC)
-38.330°N 39.084°E
https://www.volcanodiscovery.com/earthquakes/2020/01/24/17h55/magnitude7-Turkey-quake.html
1/24/20 – Methane Report for CAMS Data for Wednesday, 1/22/20
NOTE: This is NOT a silent movie. I’m going to start giving short audio commentary on these updates.
1/24/20 – Methane Report for CAMS Data for Thursday, 1/23/20
1/25/20 – Methane Report for CAMS Data for Friday, 1/24/20
1/25/20 – Methane Report for CAMS Data for Saturday, 1/25/20
1/25/20 – from Robin Westenra: Depopulation and biowarfare – a discussion with Margo
Margo and I had an extended discussion, looking at some of the issues around the current coronavirus outbreak in Wuhan, China and speculated about what could be behind it.
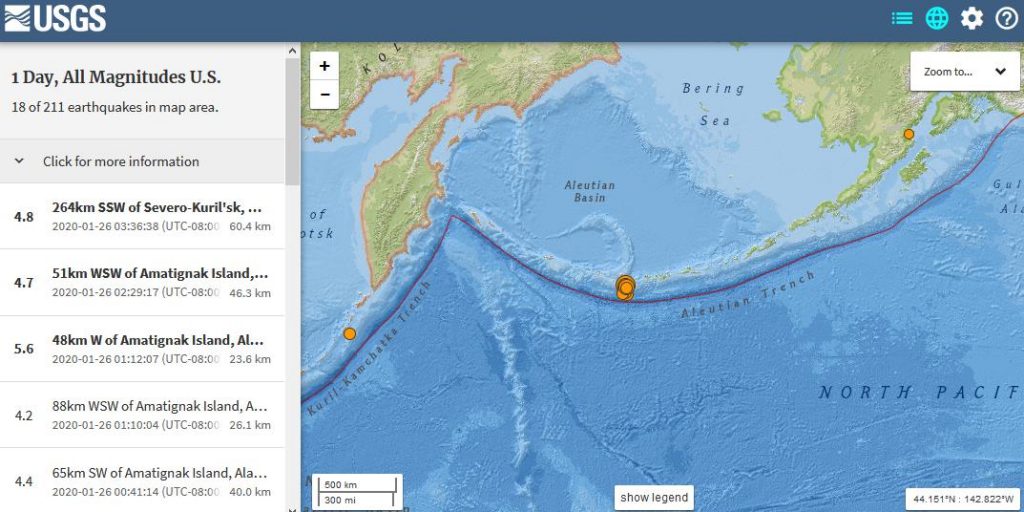
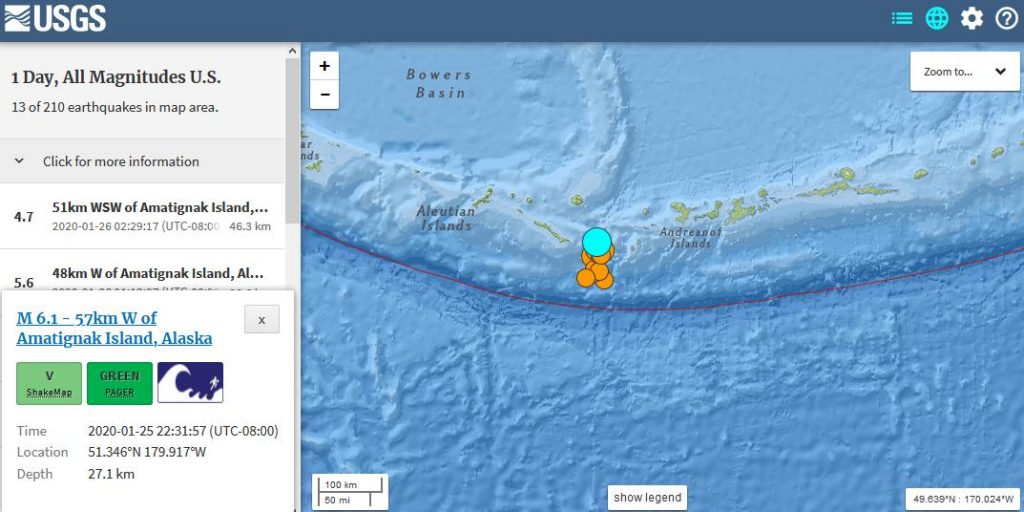
1/26/20 – Lots of Shaking in the Aleutian Islands
M 6.1 – 57km W of Amatignak Island, Alaska
-2020-01-26 06:31:57 (UTC)
-51.346°N 179.917°W
-27.1 km depth
1/26/20 – Methane Report for CAMS Data for Sunday, 1/26/20
1/26/20 – Methane & Climate Update with Margo (Jan. 26, 2020)
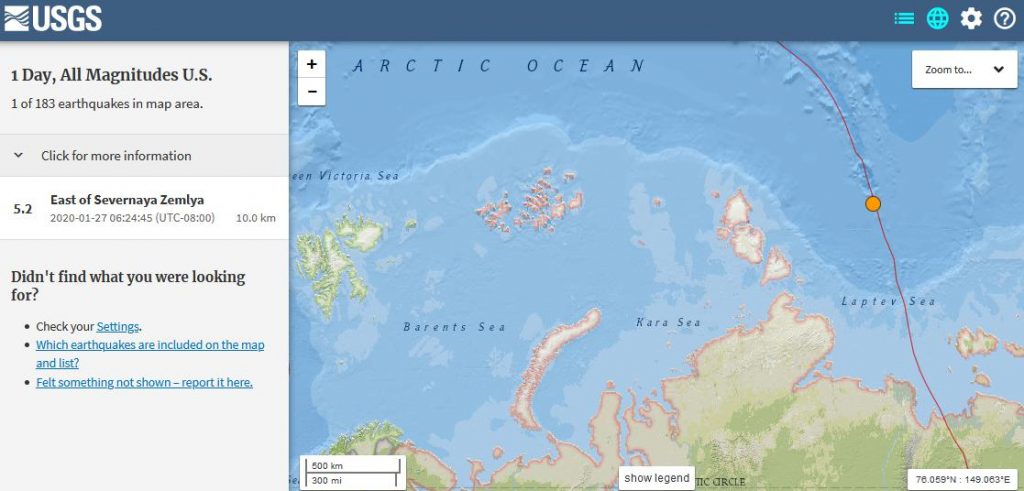
1/27/20 – Another Large Arctic Earthquake Near the North Pole!
M 5.2 – East of Severnaya Zemlya
-2020-01-27 14:24:45 (UTC)
-80.809°N 121.330°E
1/27/20 – Methane Report for CAMS Data for Monday, 1/27/20
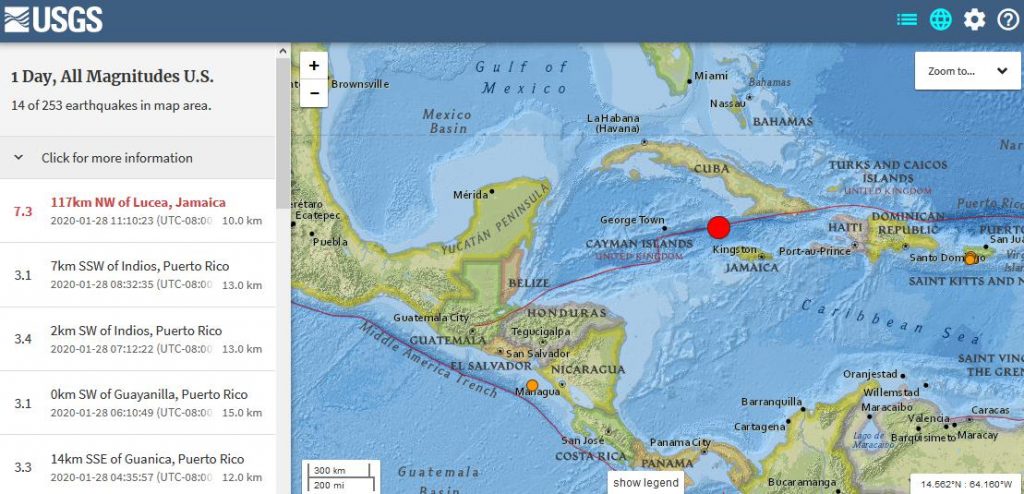
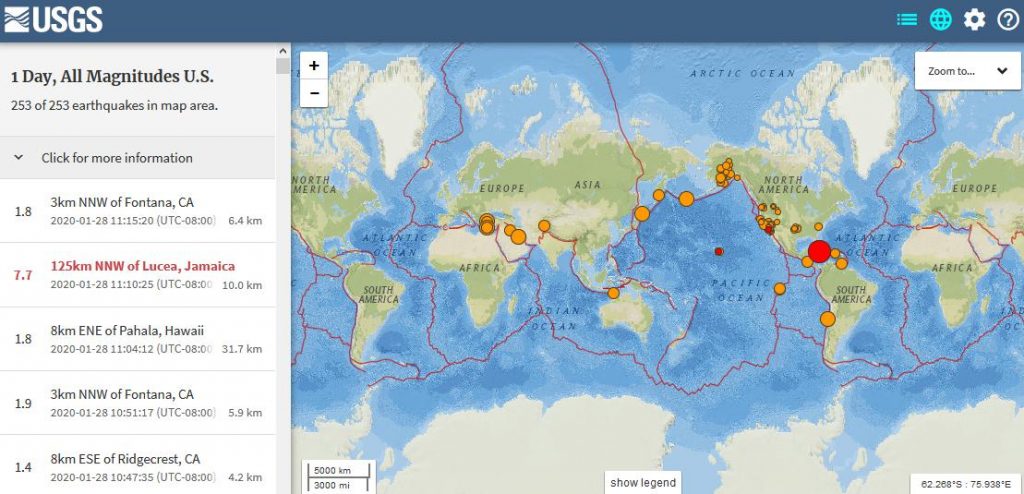
1/28/20 – Huge Earthquake Near Jamaica Equal to 84 Atomic Bombs!
M 7.3 – 117km NW of Lucea, Jamaica
-2020-01-28 19:10:23 (UTC)
-19.315°N 78.814°W
USGS Upgraded it to a 7.7 M Earthquake
M 7.7 – 125km NNW of Lucea, Jamaica
-2020-01-28 19:10:25 (UTC)
-19.440°N 78.755°W
1/28/20 – Methane Report for CAMS Data for Tuesday, 1/28/20
1/29/20 – Coronavirus and Global Warming
–Margo
Quoting Professor Guy McPherson ;
“The impact of the aerosol masking effect has been greatly underestimated, as pointed out in an 8 February 2019 article in Science. As indicated by the lead author of this paper on 25 January 2019: “Global efforts to improve air quality by developing cleaner fuels and burning less coal could end up harming our planet by reducing the number of aerosols in the atmosphere, and by doing so, diminishing aerosols’ cooling ability to offset global warming.” The cooling effect is “nearly twice what scientists previously thought.” That this February 2019 paper cites the conclusion by Levy et al. (2013) indicating as little as 35% reduction in industrial activity drives a 1 C global-average rise in temperature suggests that as little as a 20% reduction in industrial activity is sufficient to warm the planet 1 C within a few days or weeks.”
Guy and I both believe a serious economic crash could be the end of us! None of these risks operate in a vacuum, they are all connected.
1/29/20 – Methane Report for CAMS Data for Wednesday, 1/29/20 & Thoughts on Coronavirus & Global Warming
1/29/20 – Methane Report for Wed., 1/29/20, Coronavirus & Global Warming with Margo (Jan. 29, 2020)
Margo gives a methane update for CAMS data for Wednesday, 1/29/20. She also shares her thoughts about the implications of the coronavirus and global warming.
1/30/20 – Methane Report for CAMS Data for Thursday, 1/30/20
Margo also shares a vision of Jesus she had last night while in prayer.