8/1/23 – 292 Earthquakes Worldwide Today
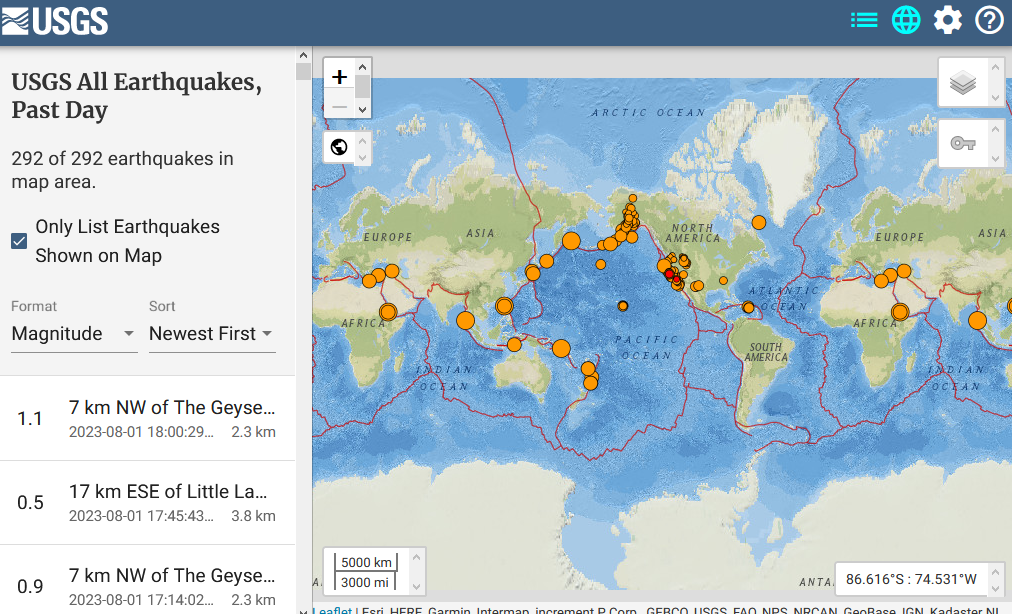
M 4.3 – Davis Strait
- 2023-08-01 19:29:04 (UTC)
- 61.411°N 59.808°W
- 14.7 km depth
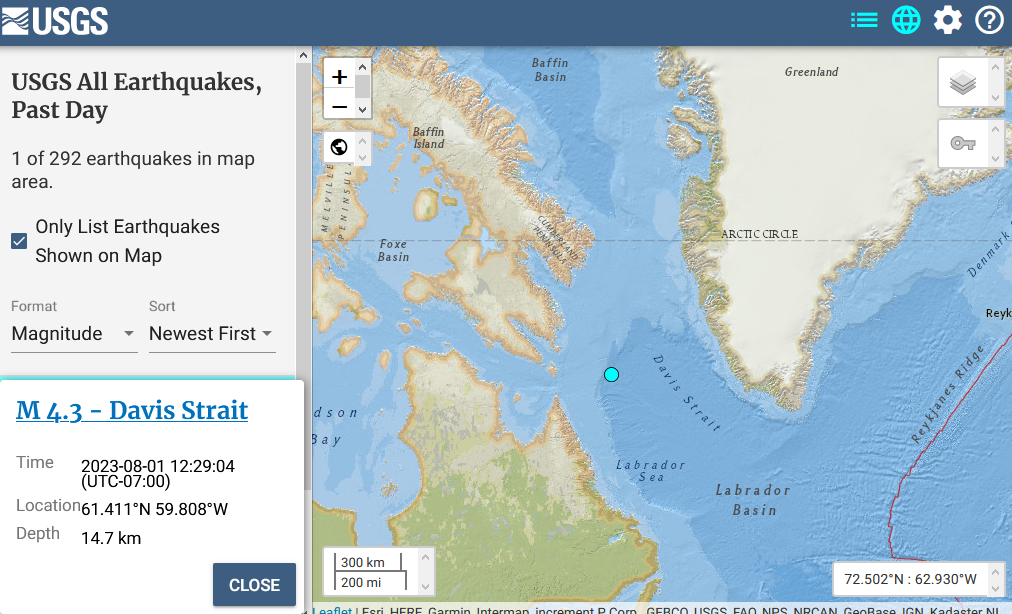
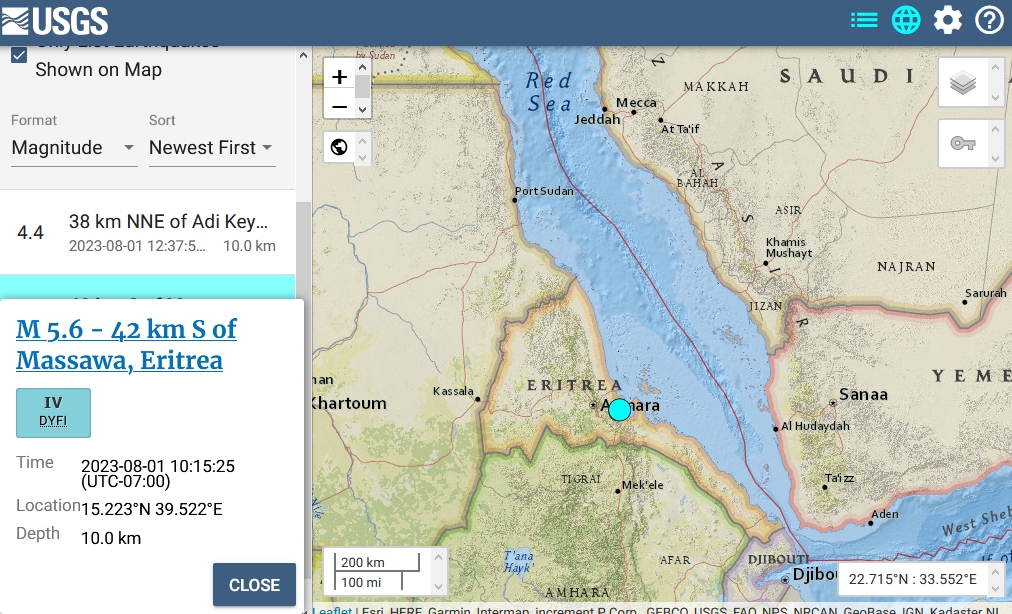
M 5.6 – 42 km S of Massawa, Eritrea
- 2023-08-01 17:15:25 (UTC)
- 15.223°N 39.522°E
- 10.0 km depth
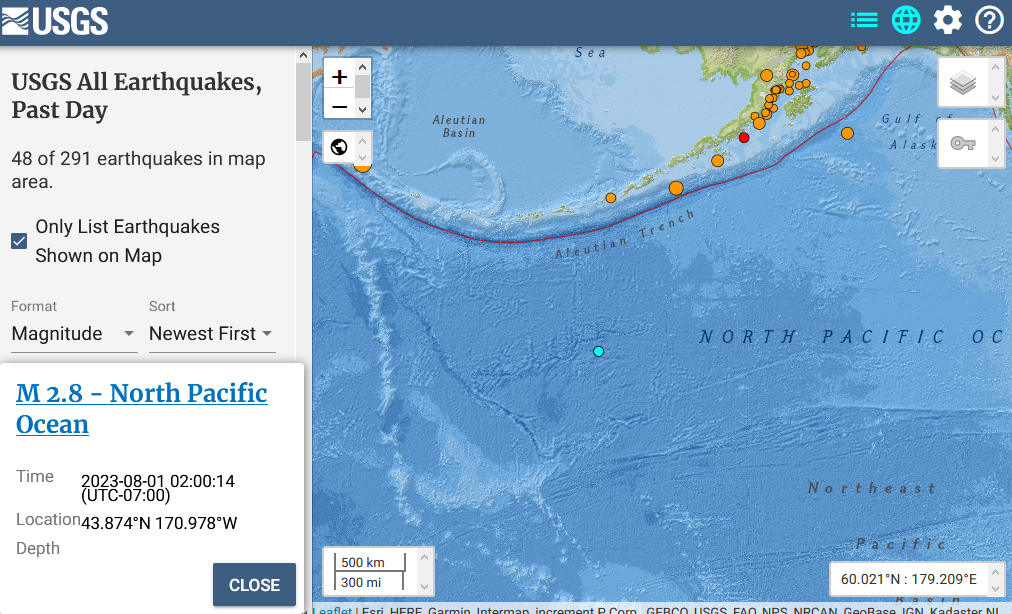
M 2.8 – North Pacific Ocean
- 2023-08-01 09:00:14 (UTC)
- 43.874°N 170.978°W
- 0.0 km depth
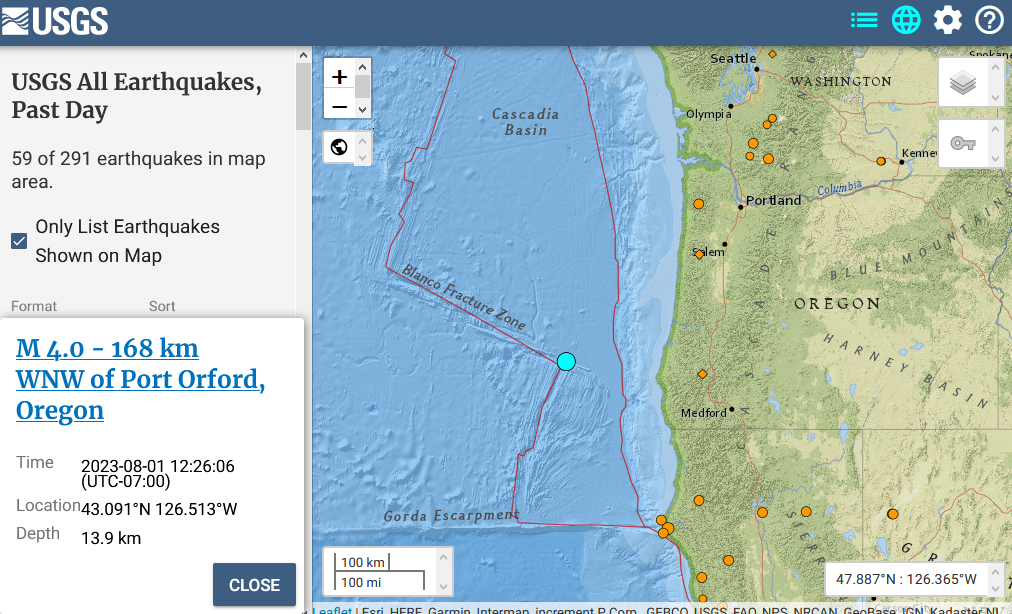
M 4.0 – 168 km WNW of Port Orford, Oregon
- 2023-08-01 19:26:06 (UTC)
- 43.091°N 126.513°W
- 13.9 km depth
8/1/23 – Methane Report for CAMS & NOAA Data for Monday, 7/31/23 & Other Updates
Margo also reads 1 Kings Chapter 12.
8/2/23 – from Sam Carana: Wet Bulb Globe Temperature Tipping Point
High Wet Bulb Globe Temperatures (WBGT) are forecast to hit Louisiana, United States, over the next few days. The image below shows a forecast for August 2, 2023, 18 UTC, with WBGT as high as 35°C forecast for a location 10 miles South East of Abbeville, Louisiana, U.S.
http://arctic-news.blogspot.com/2023/07/wet-bulb-globe-temperature-tipping-point.html
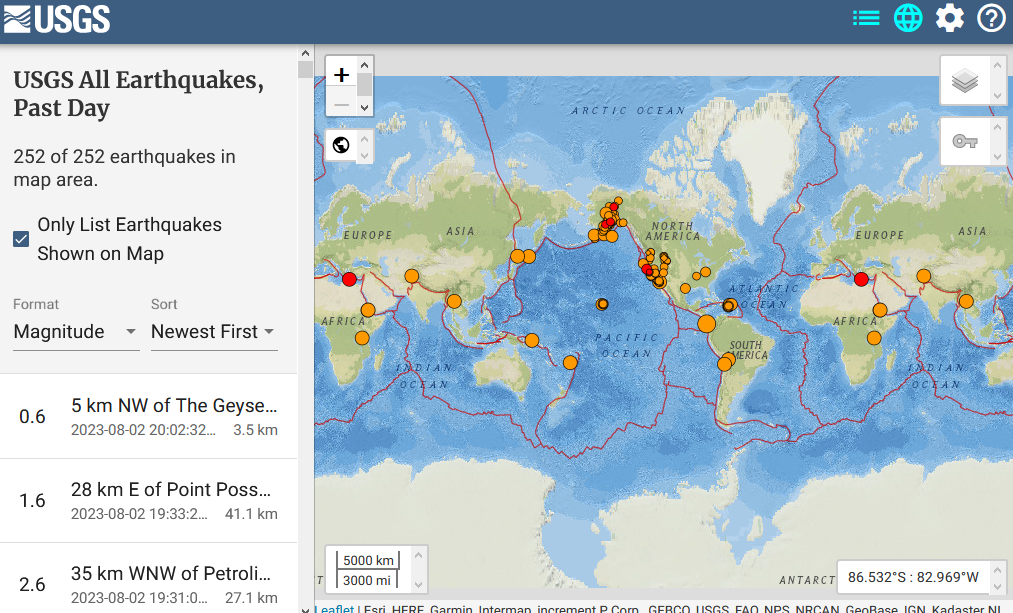
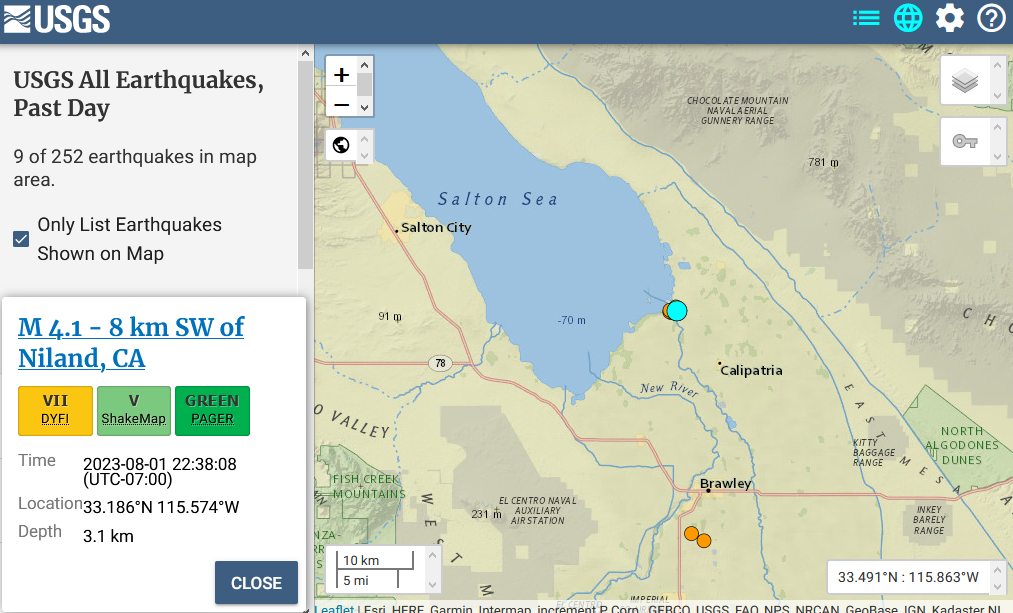
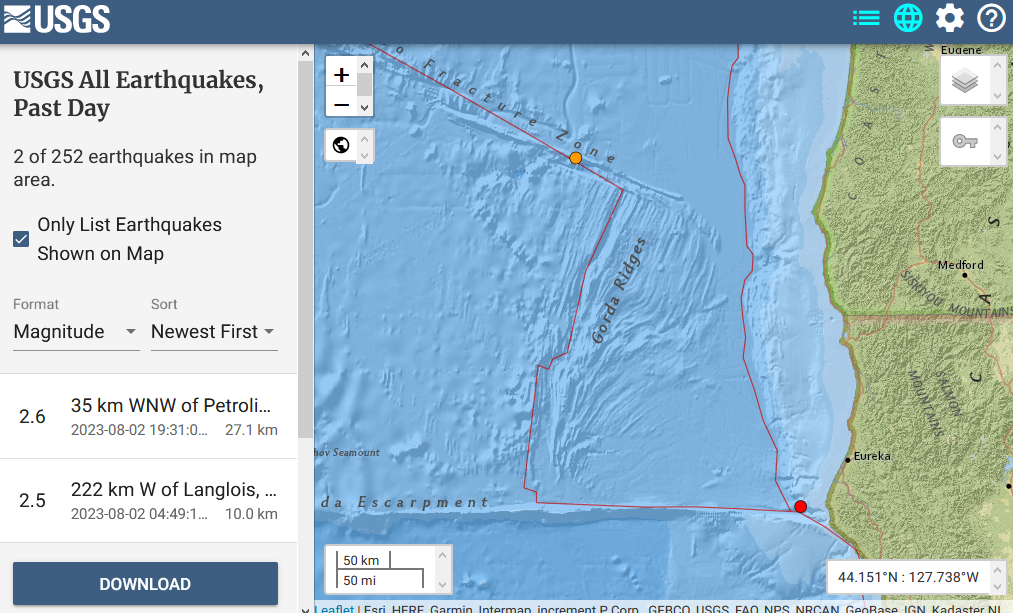
8/2/23 – 252 Earthquakes Worldwide Today
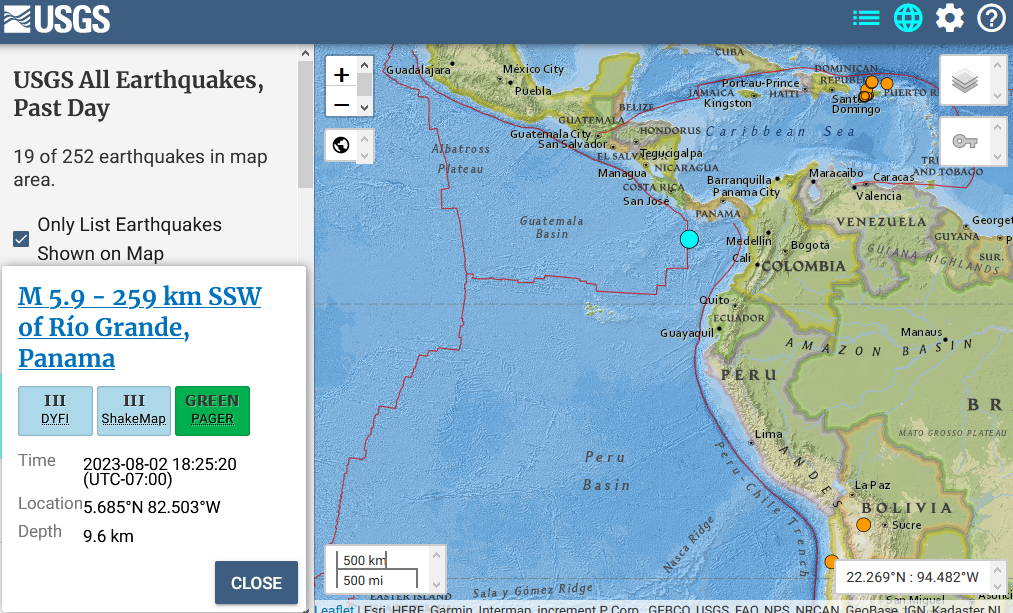
M 5.9 – 259 km SSW of Río Grande, Panama
- 2023-08-03 01:25:20 (UTC)
- 5.685°N 82.503°W
- 9.6 km depth
M 4.1 – 8 km SW of Niland, CA
- 2023-08-02 05:38:08 (UTC)
- 33.186°N 115.574°W
- 3.1 km depth
2 EQs on or near the Juan de Fuca Plate
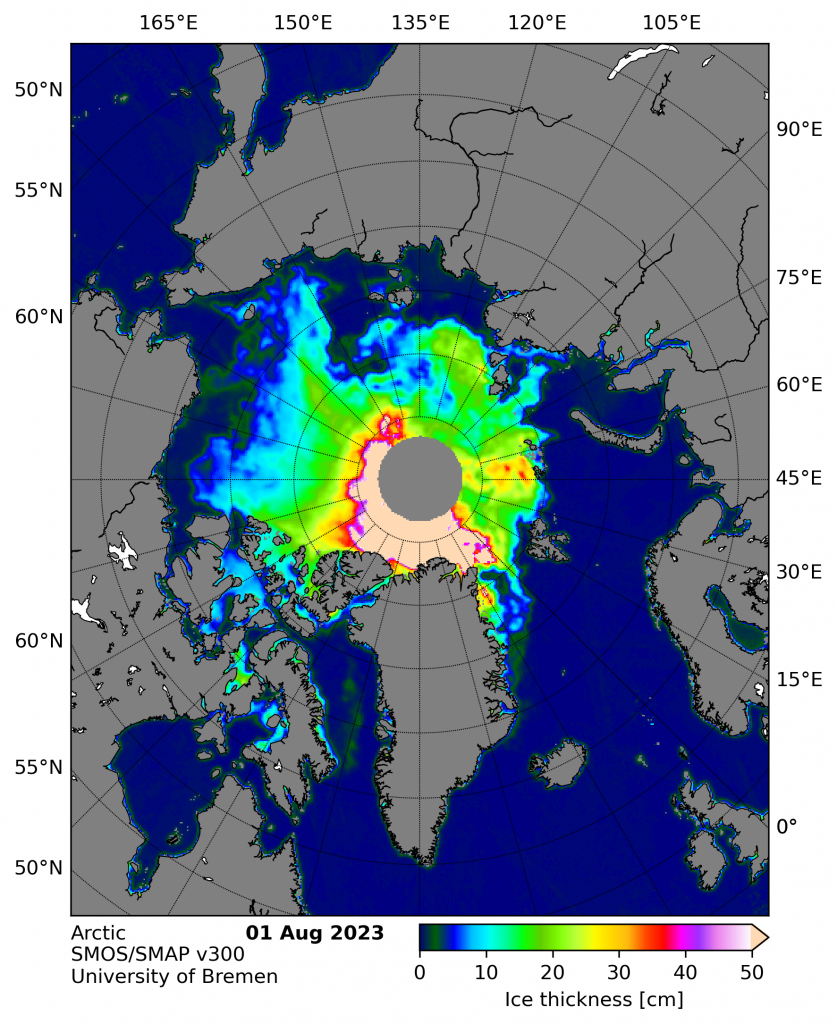
8/2/23 – A viewer sent me the link to Arctic Sea Ice Thickness on the Bremen website. Note: it’s measured in centimeters.
https://seaice.uni-bremen.de/data/smos_smap/png/north/2023/
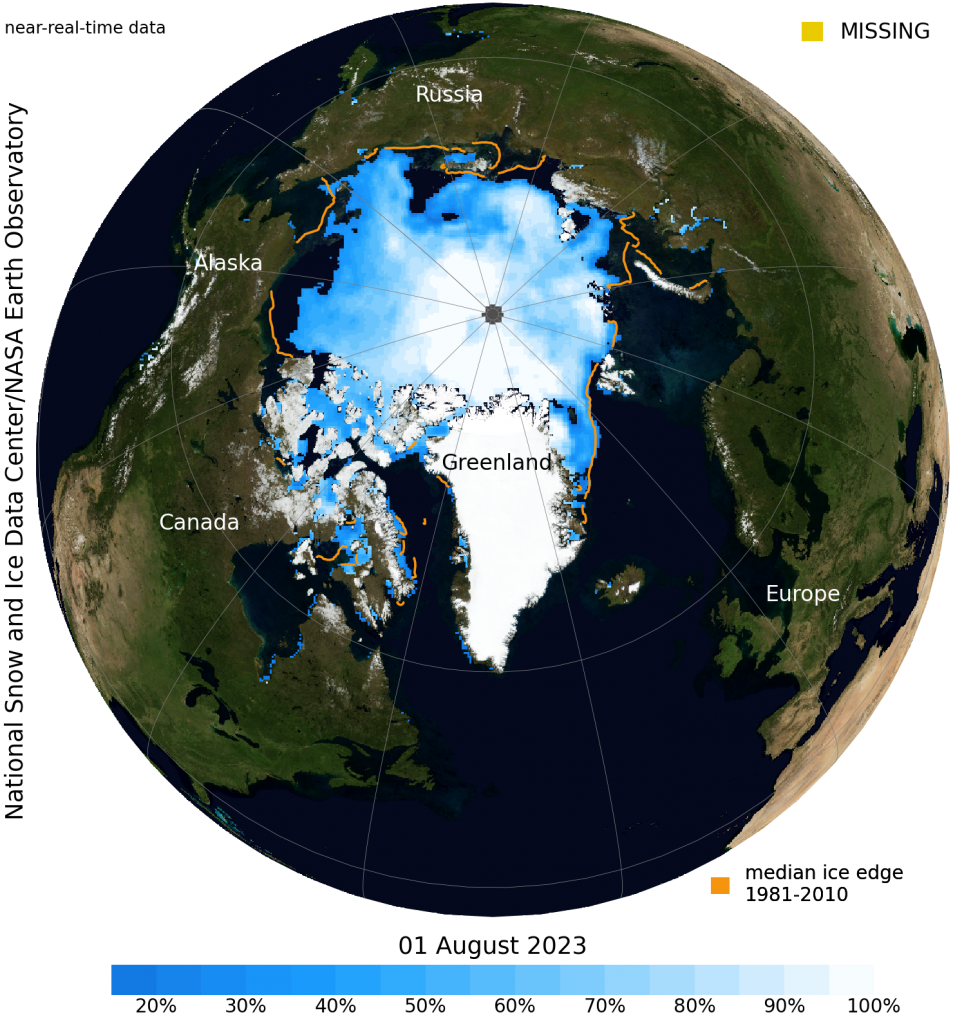
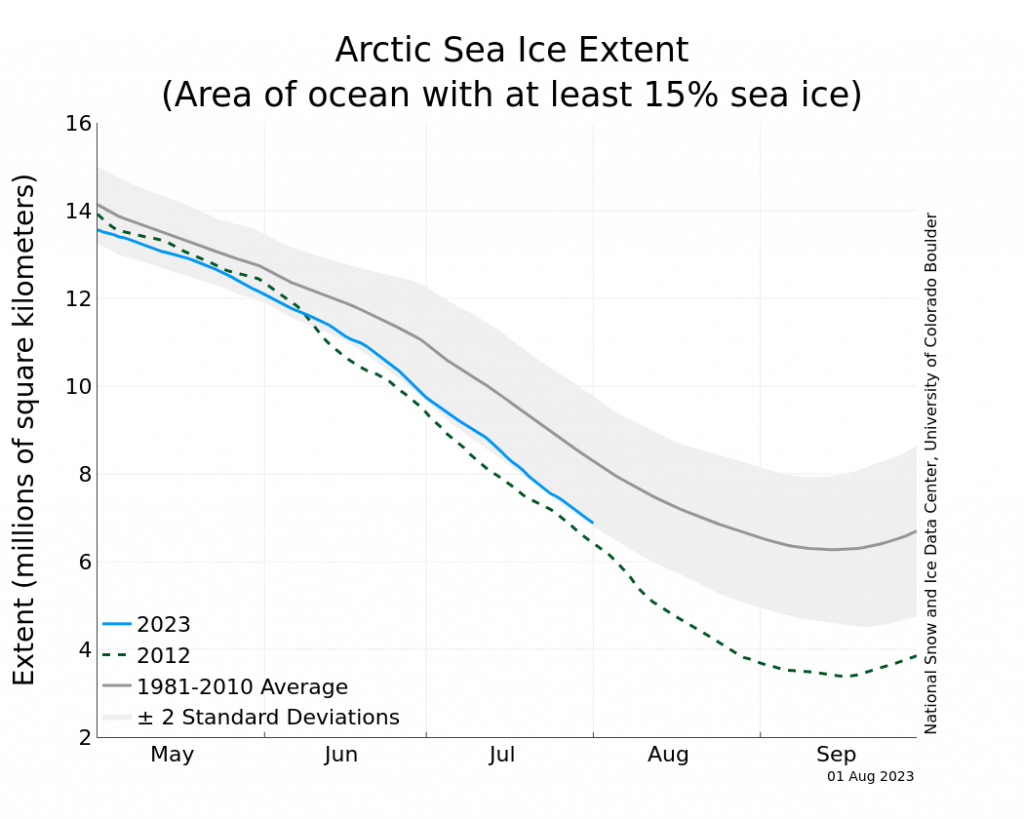
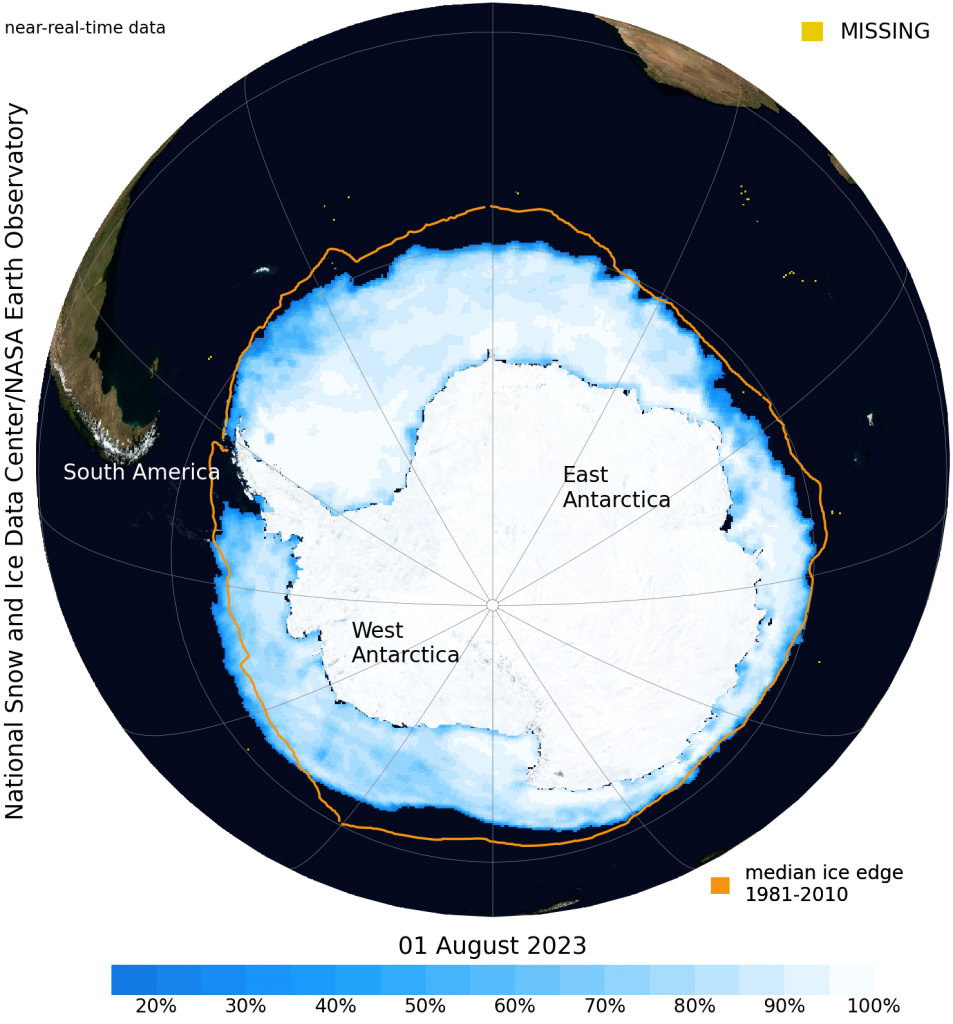
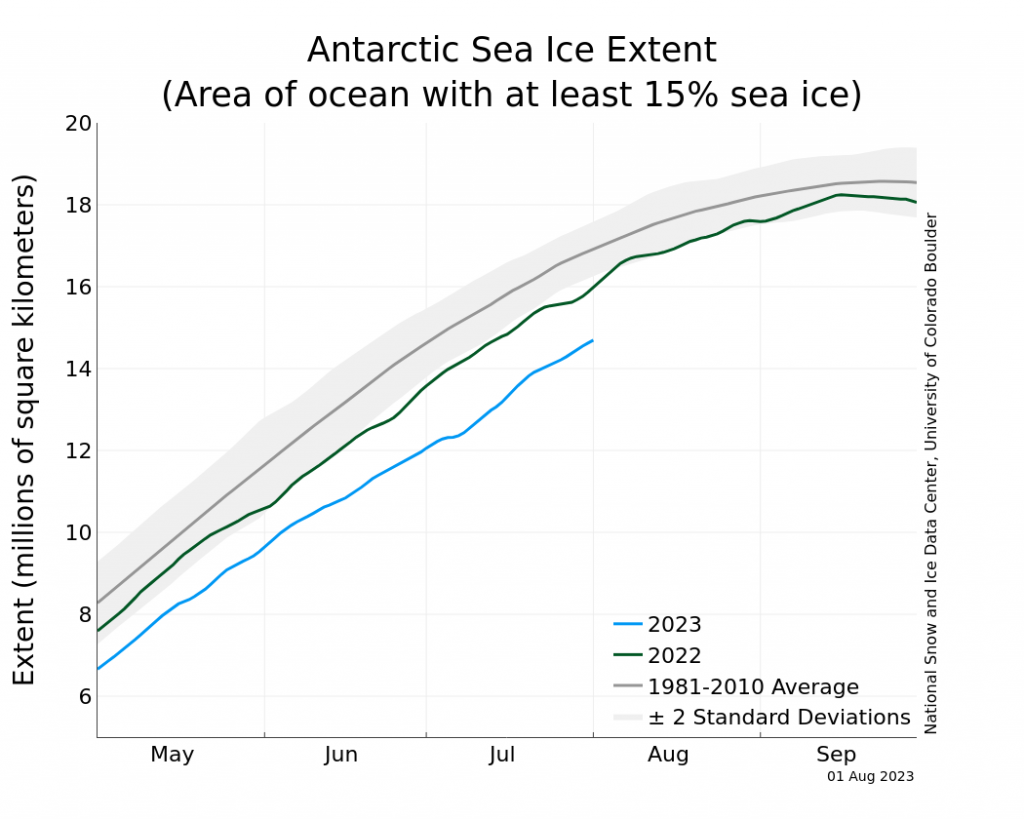
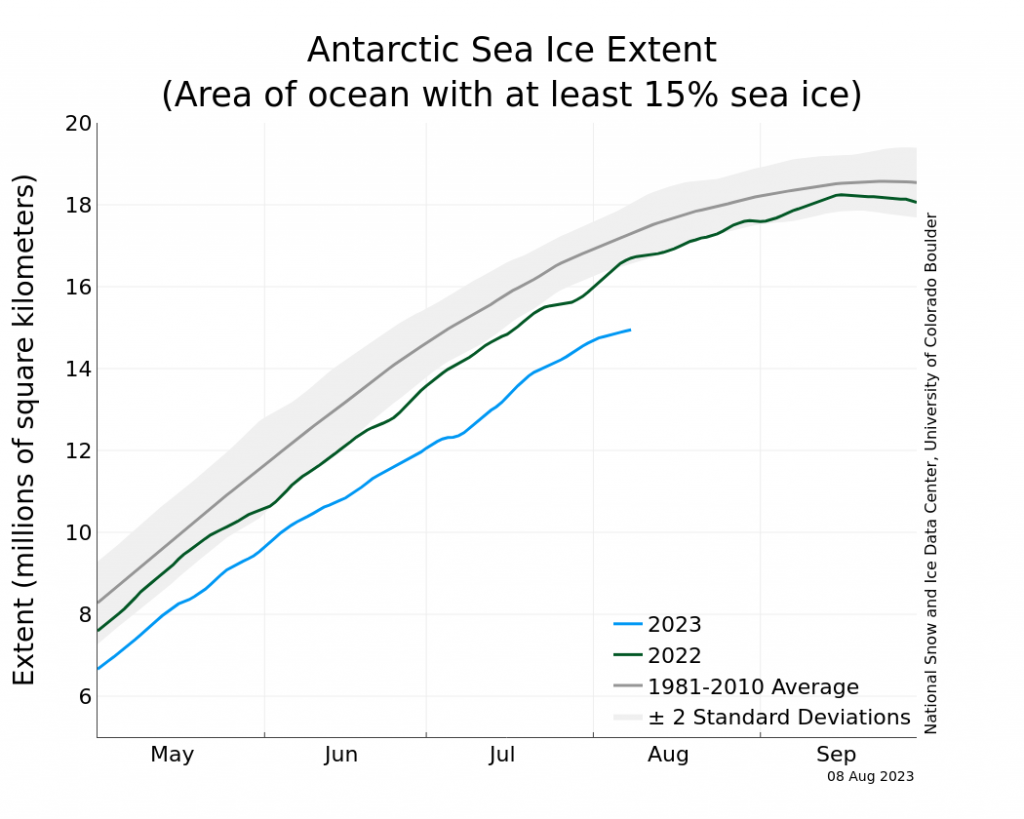
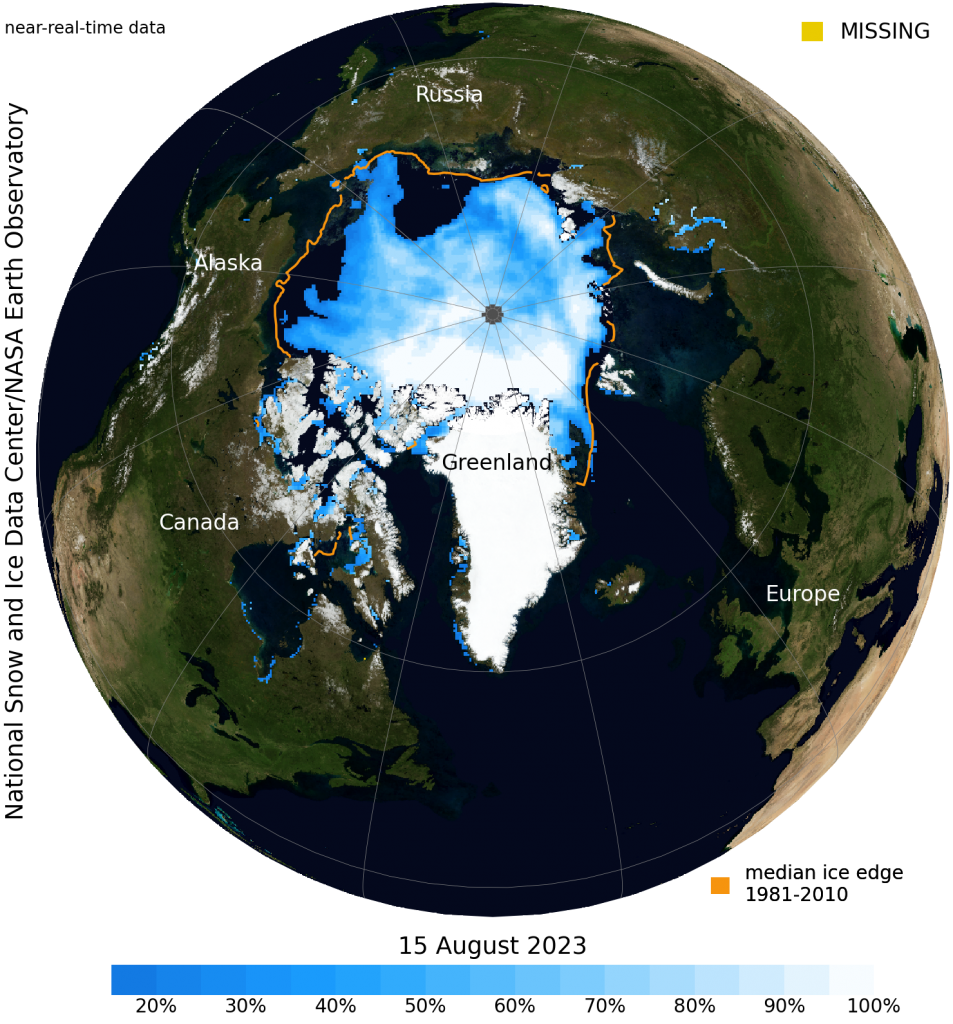
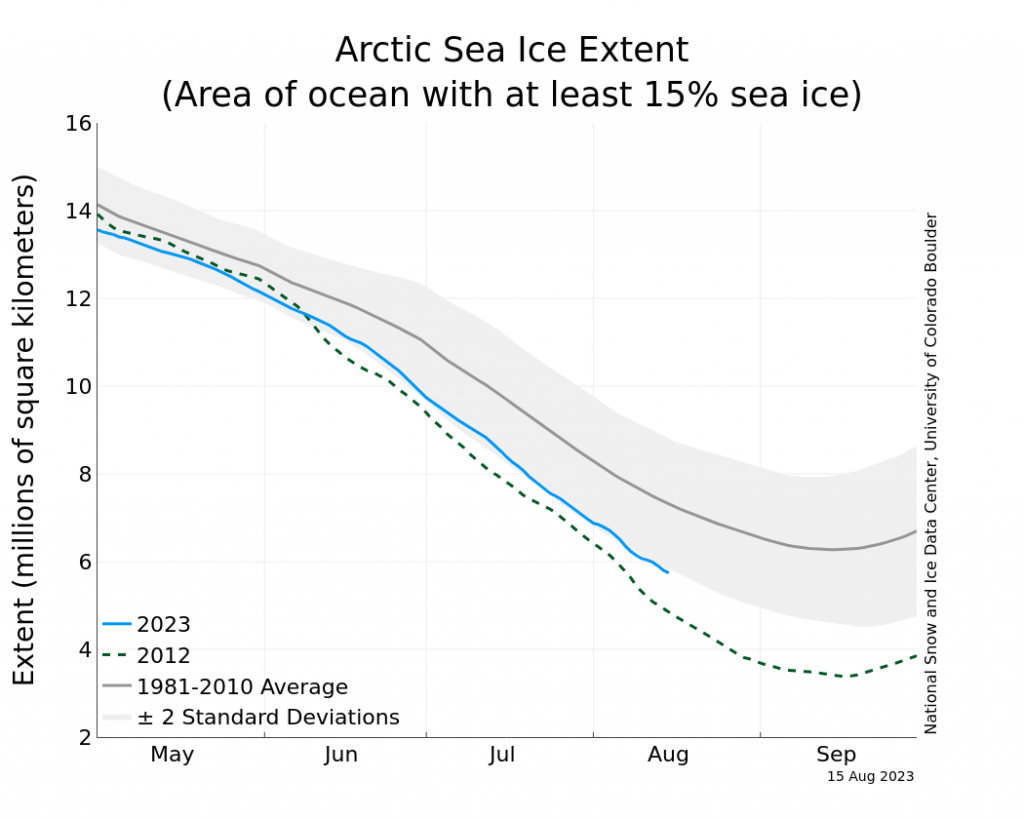
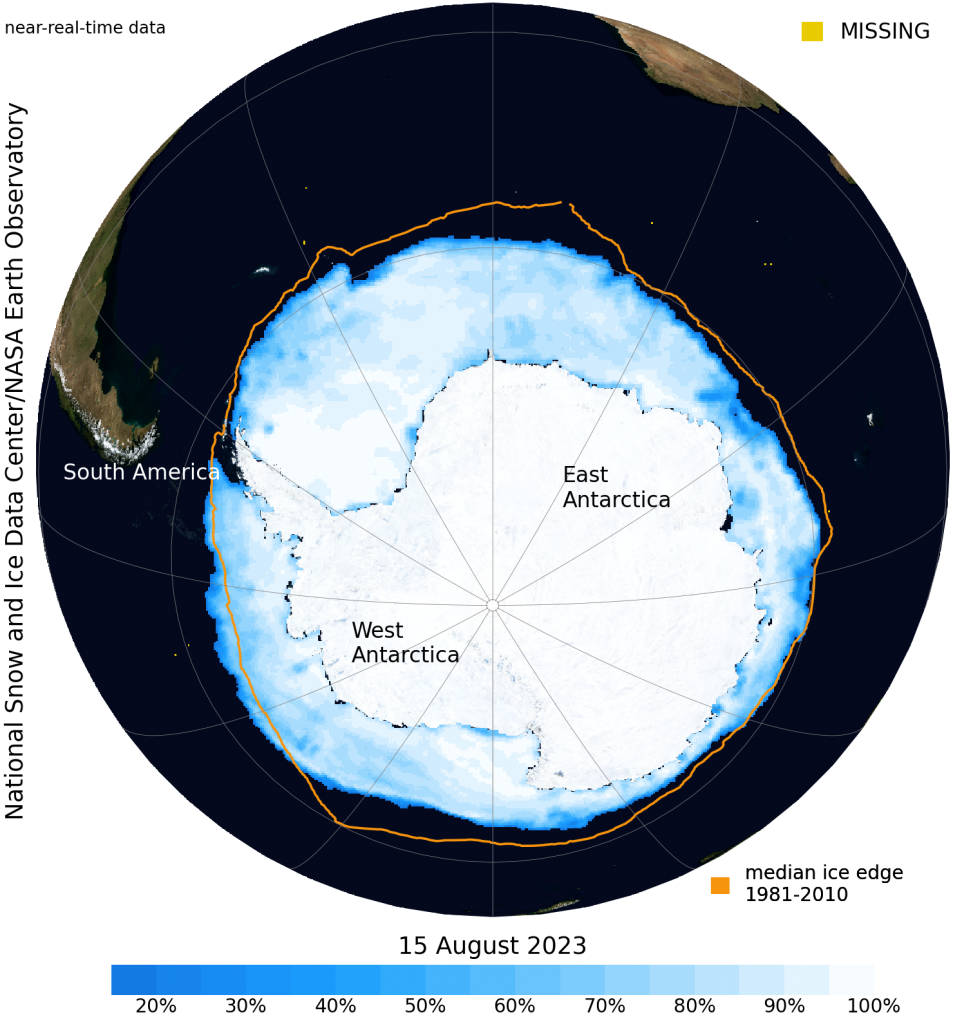
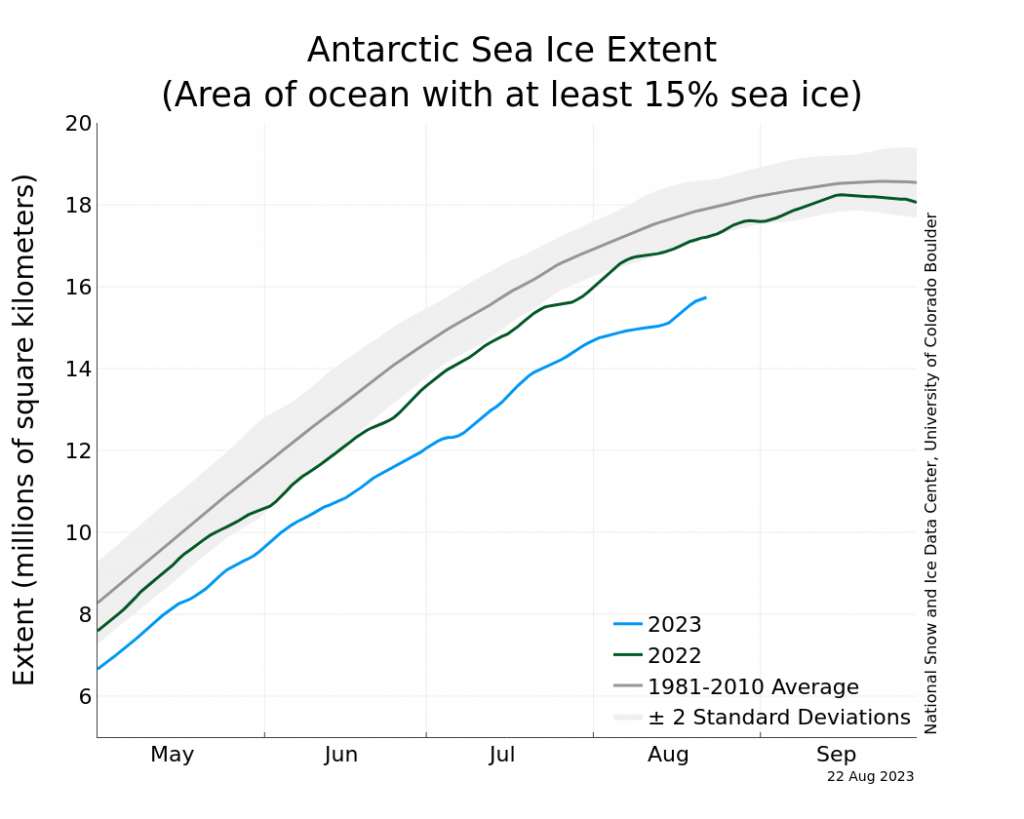
8/2/23 – NSIDC Arctic & Antarctic Sea Ice as of 8/1/23
8/2/23 – Here are the latest Arctic & Antarctic Sea Ice Thickness models from the U.S. Navy

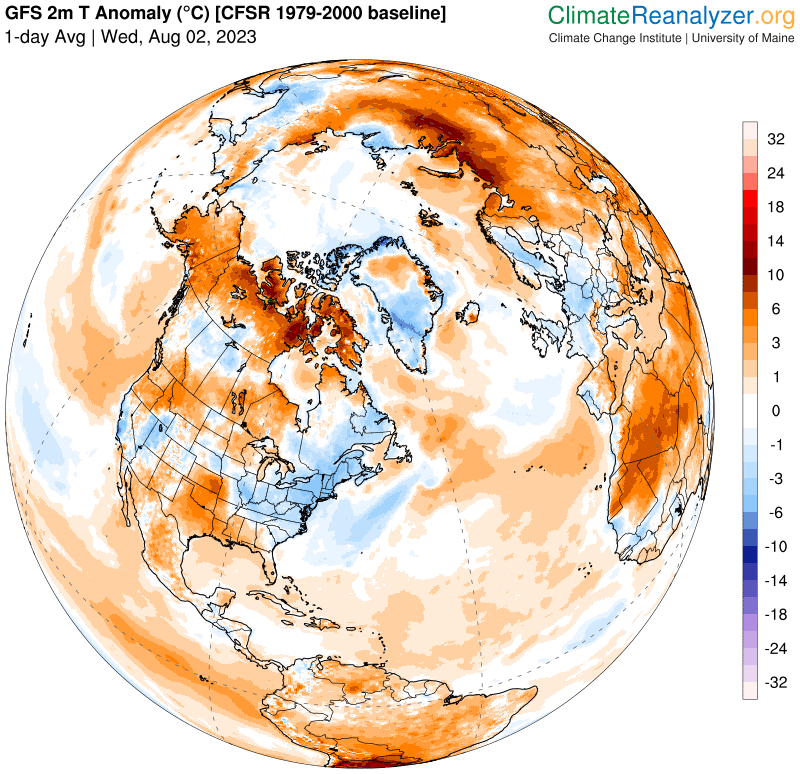
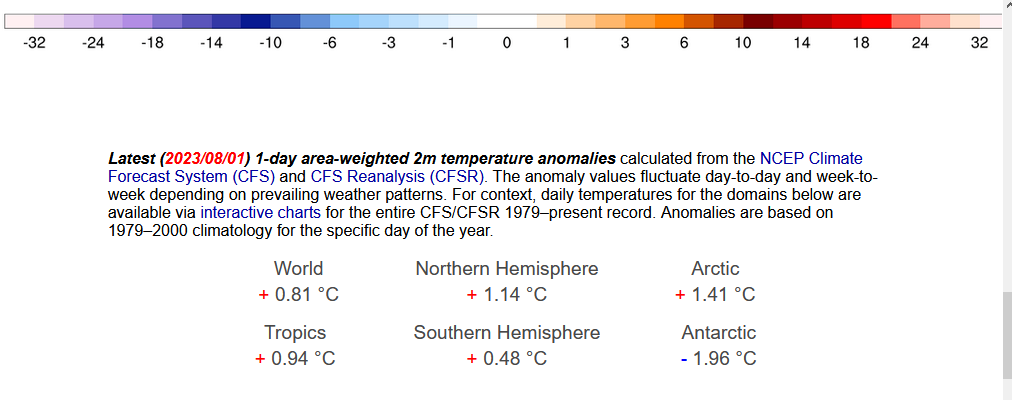
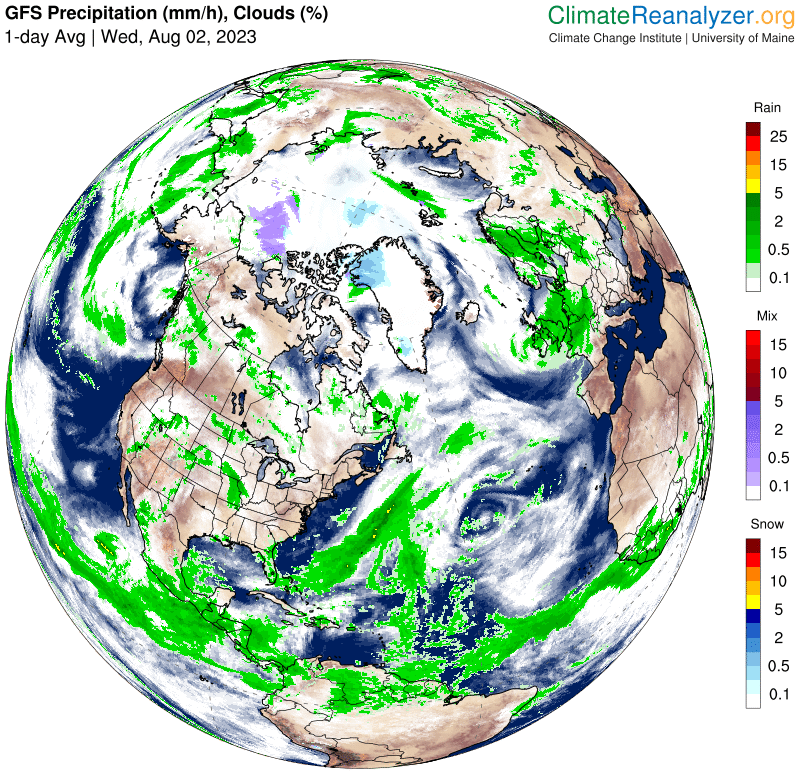
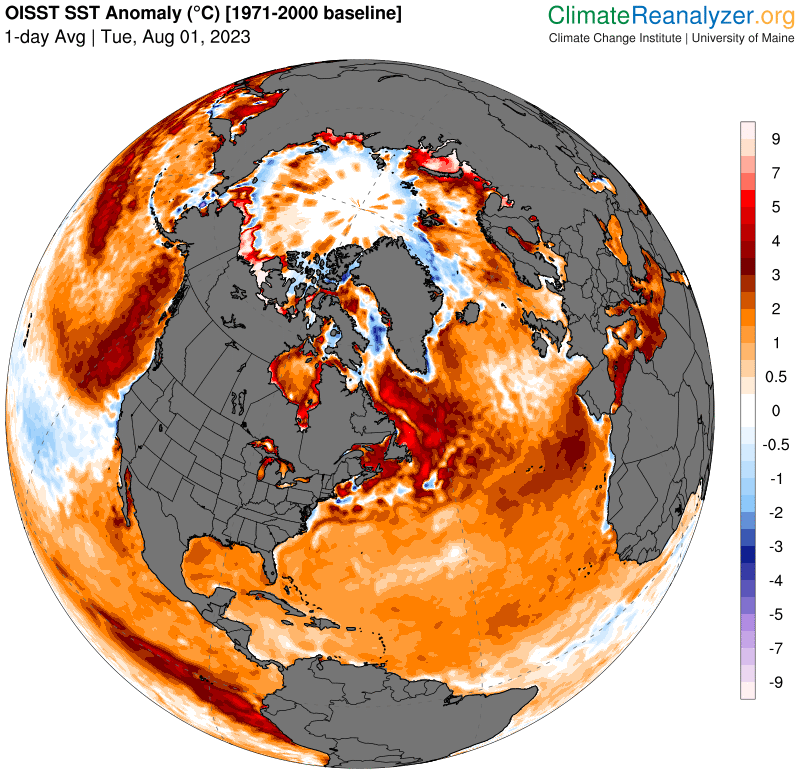
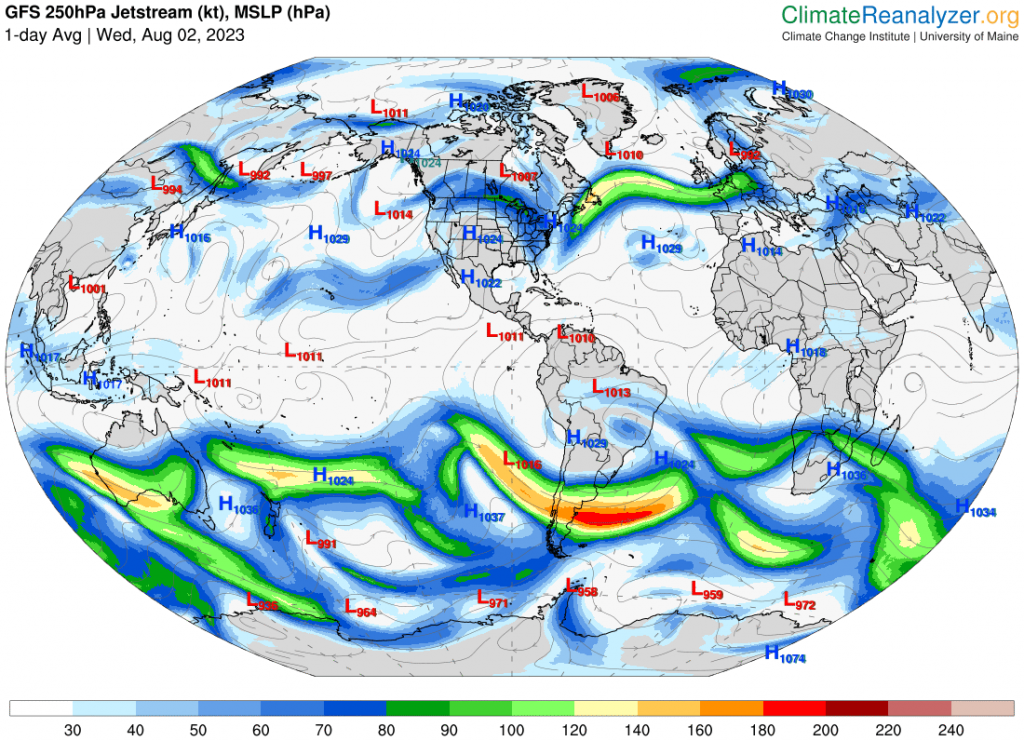
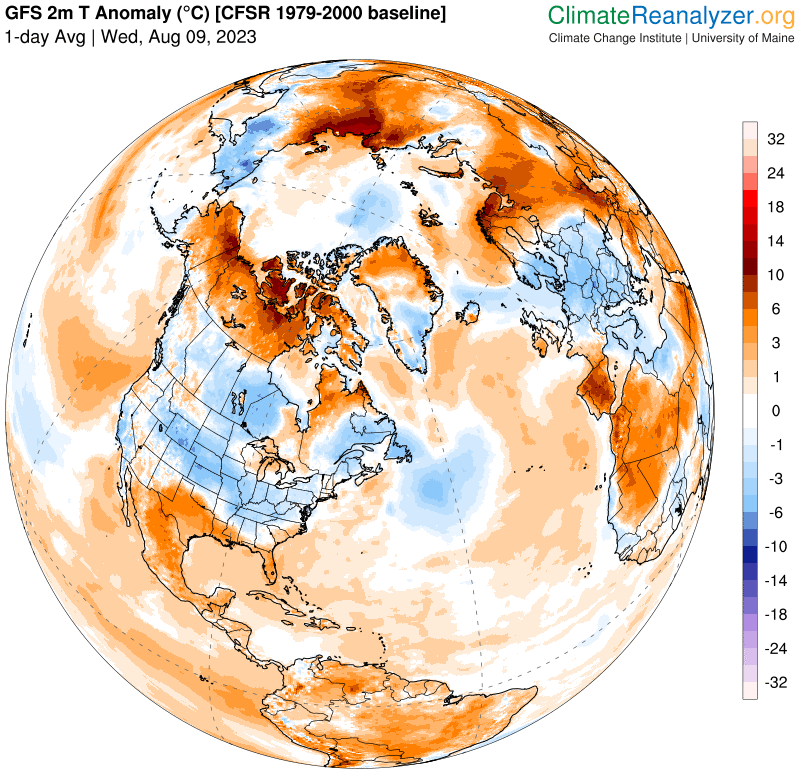
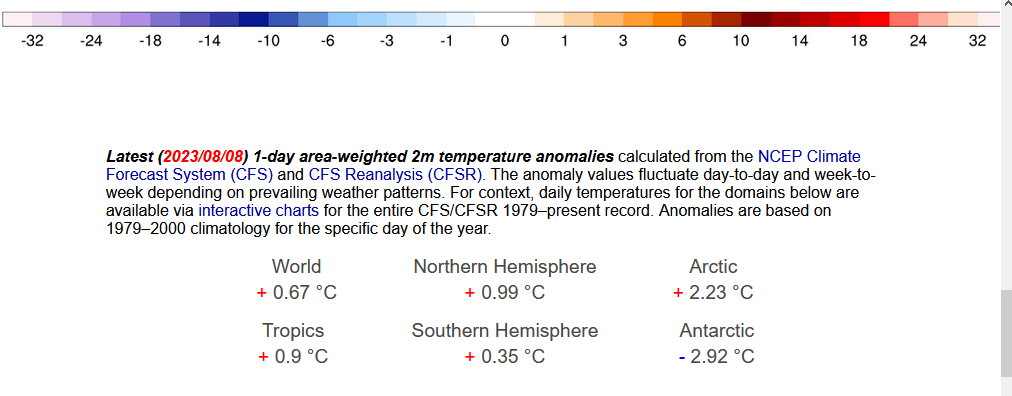
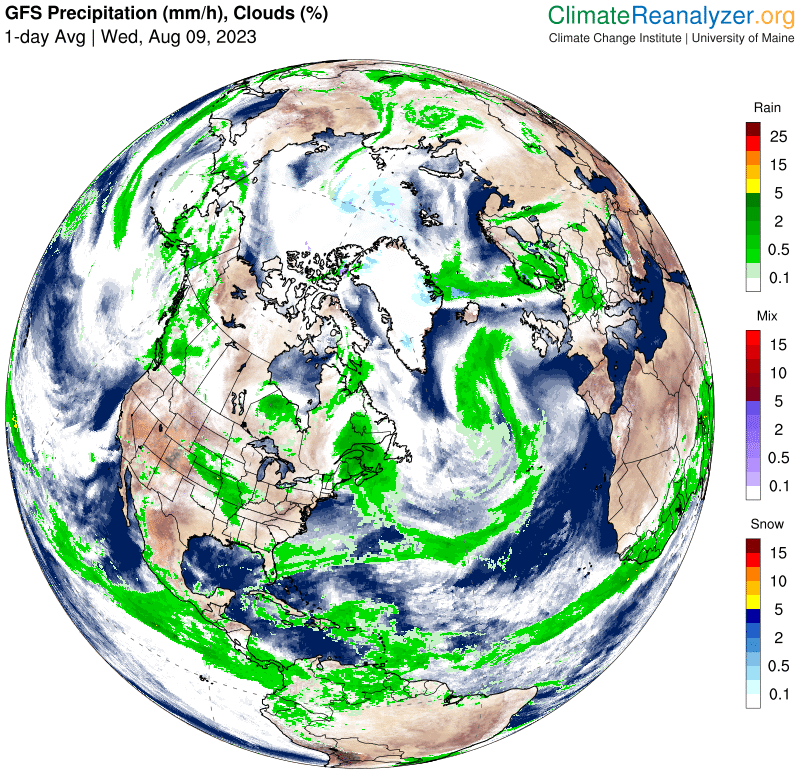
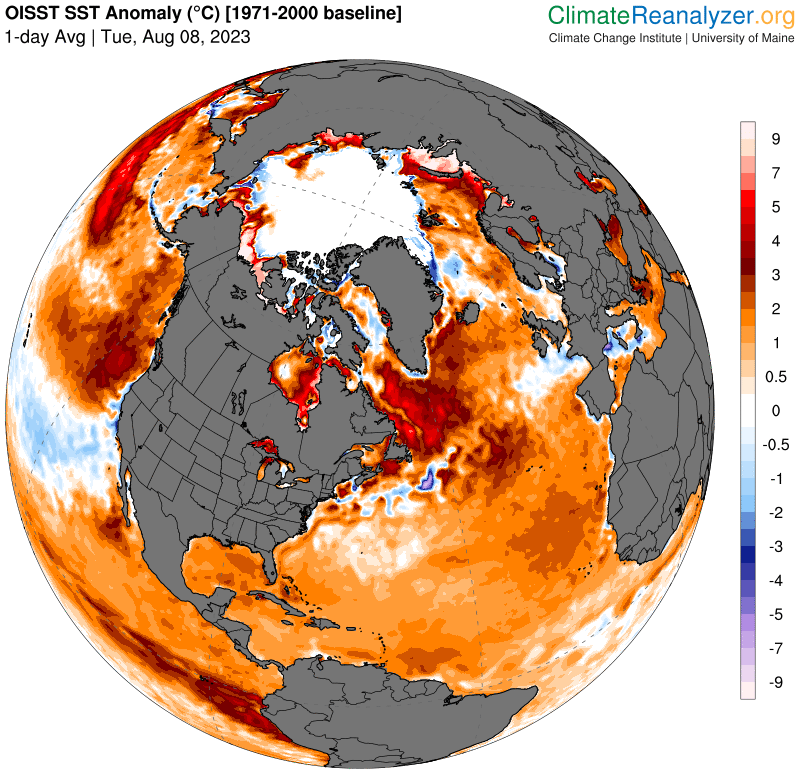
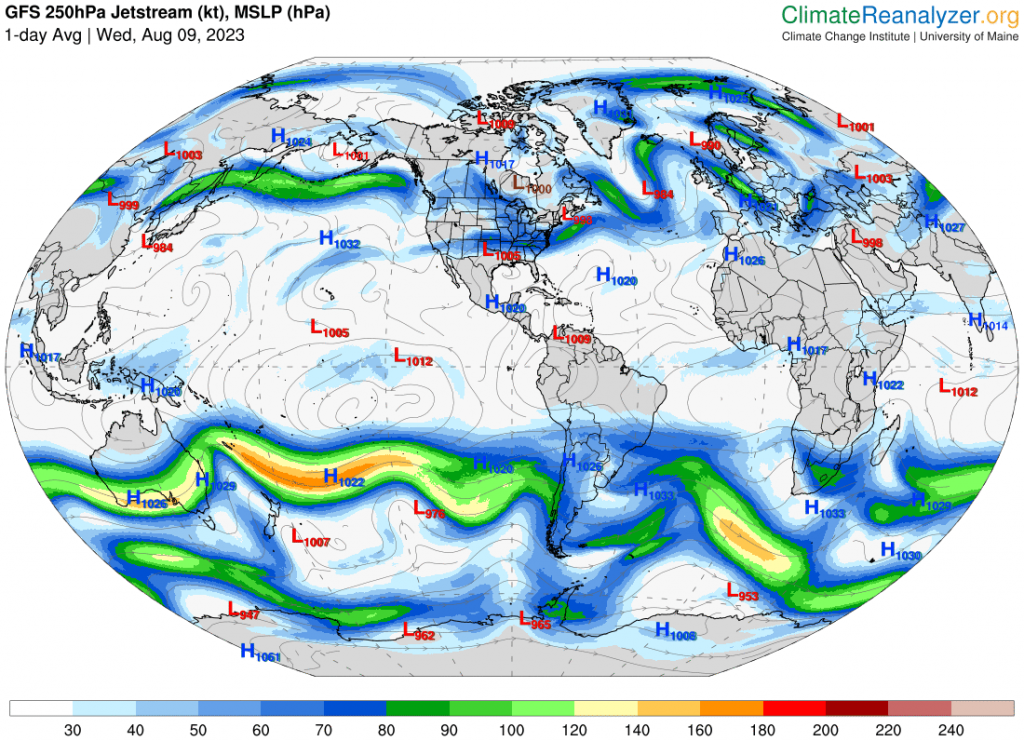
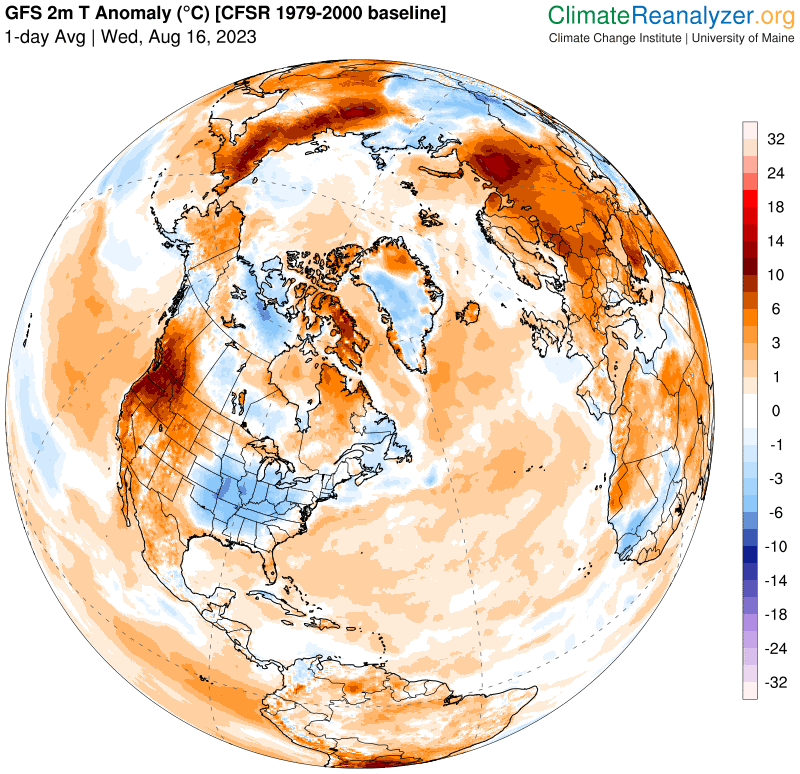
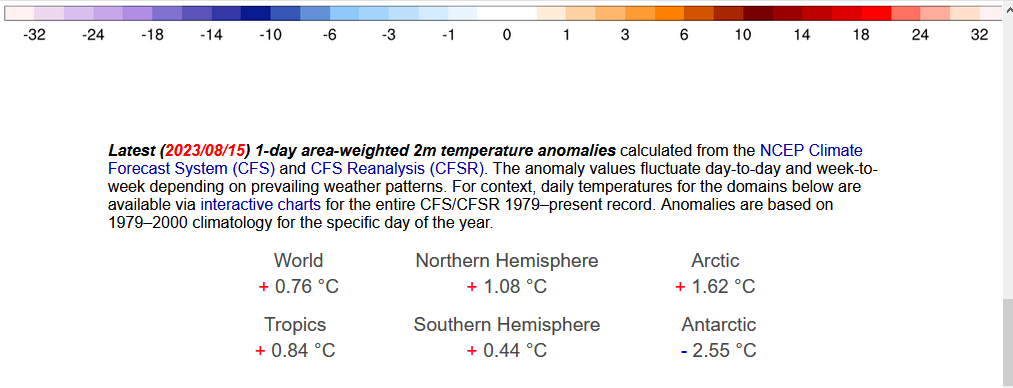
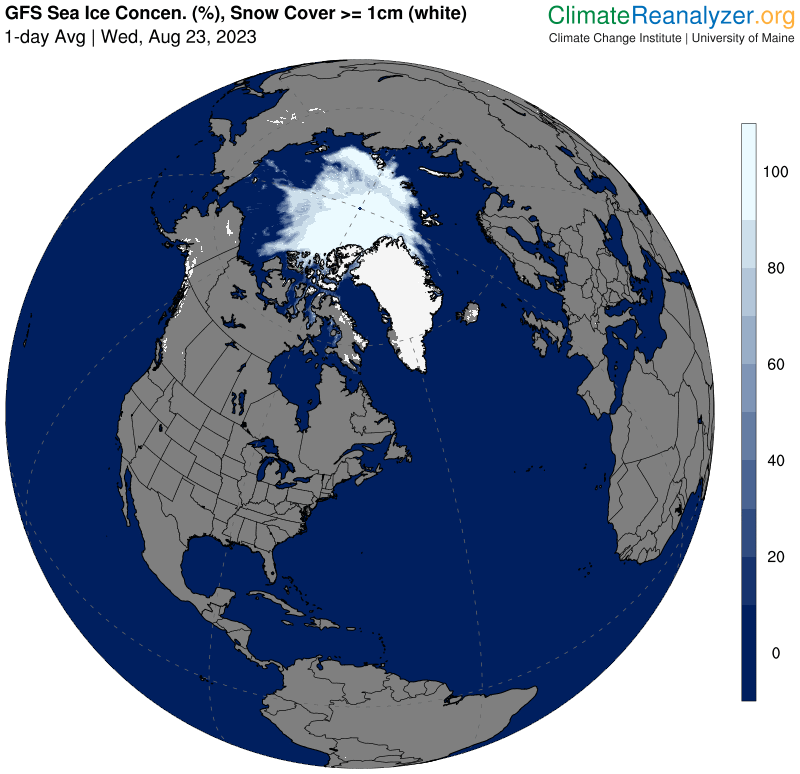
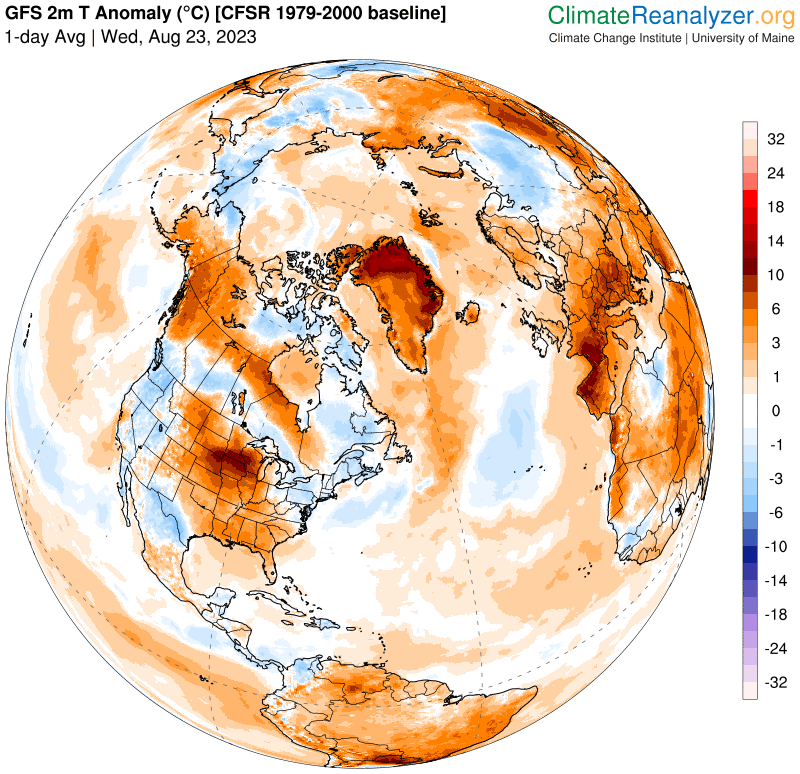
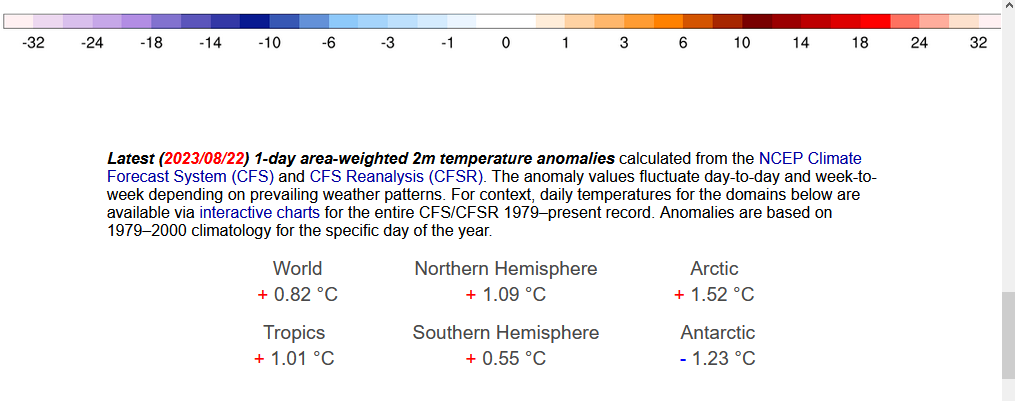
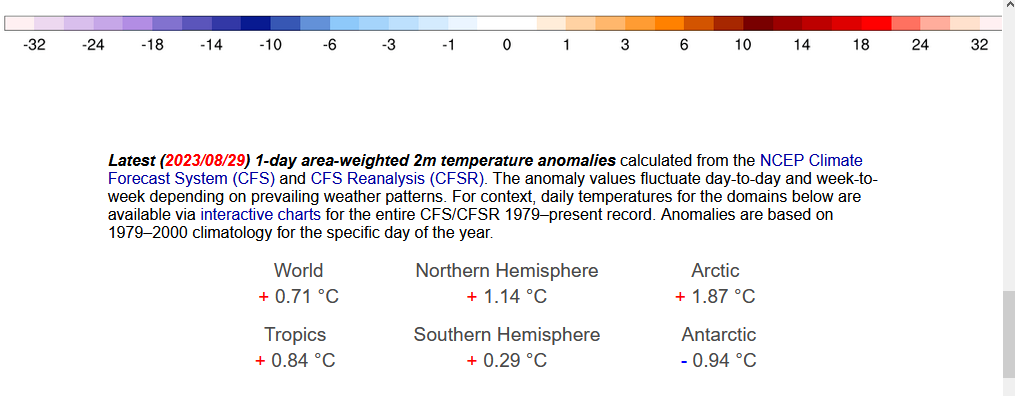
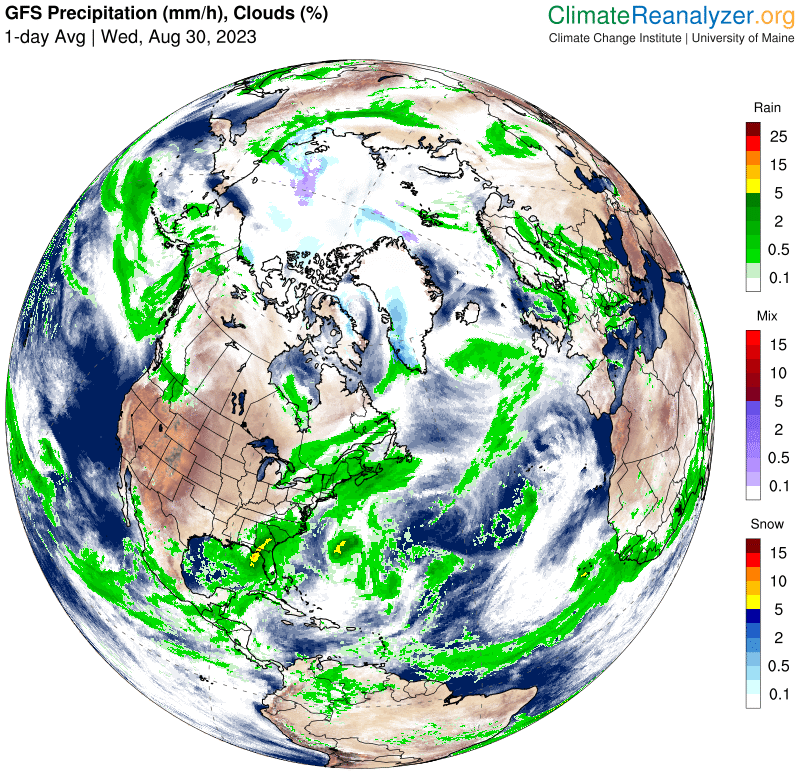
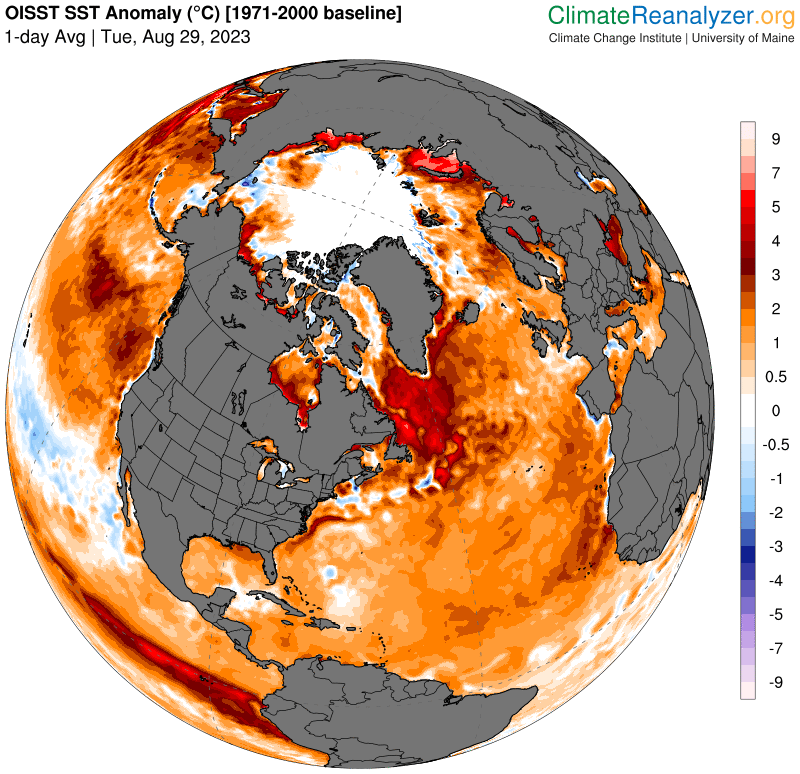
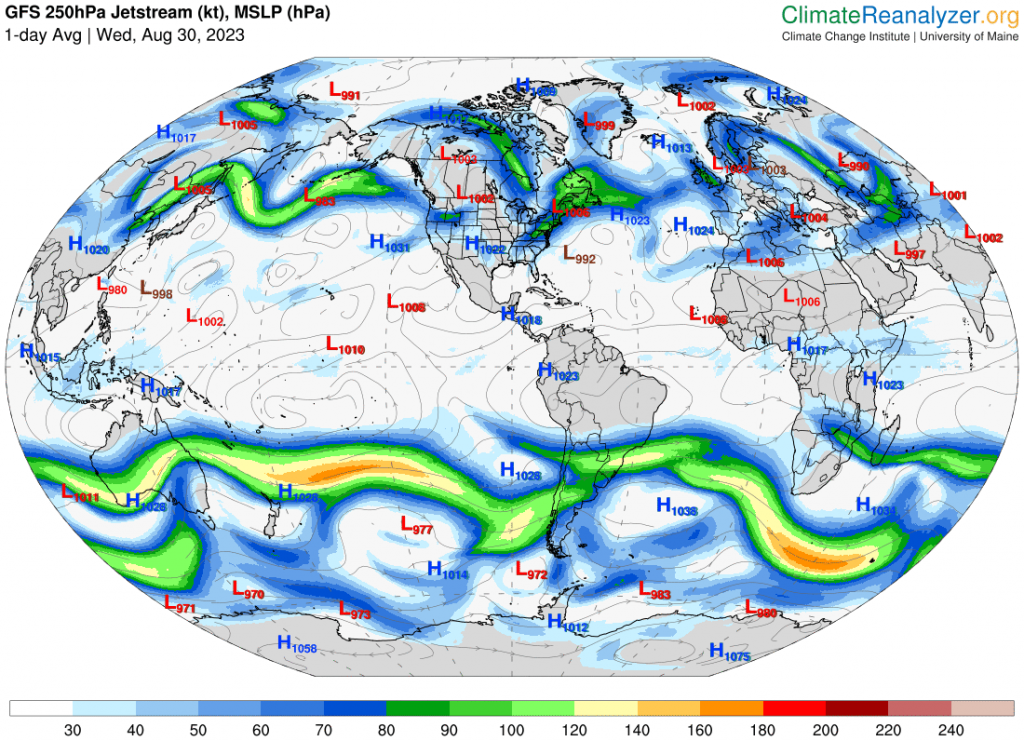
8/2/23 – Here’s the latest Arctic Data from Climate Reanalyzer

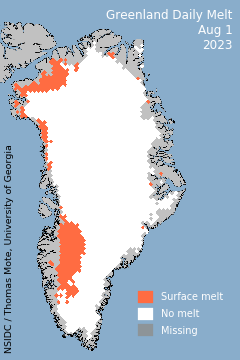
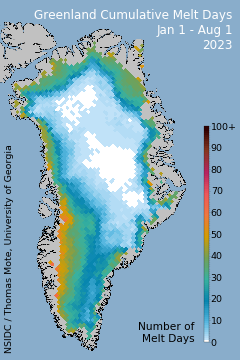
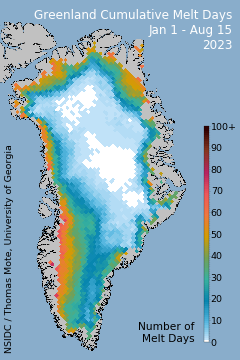
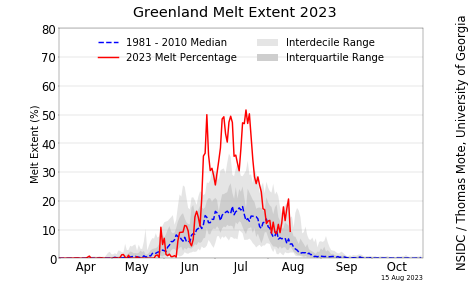
8/2/23 – NSIDC Greenland Ice Sheet Melt for 8/1/23

8/2/23 – Methane Report for CAMS & NOAA Data for Tuesday, 8/1/23 & Mid-Week Update
Show Links:
http://arctic-news.blogspot.com/2023/07/wet-bulb-globe-temperature-tipping-point.html
https://seaice.uni-bremen.de/data/smos_smap/png/north/2023/
8/4/23 – Methane Report for CAMS & NOAA Data for Wednesday, 8/2/23 & Other Updates
Margo also reads 1 Kings Chapter 14.
8/5/23 – Methane Report for CAMS Data for Thursday, 8/3/23
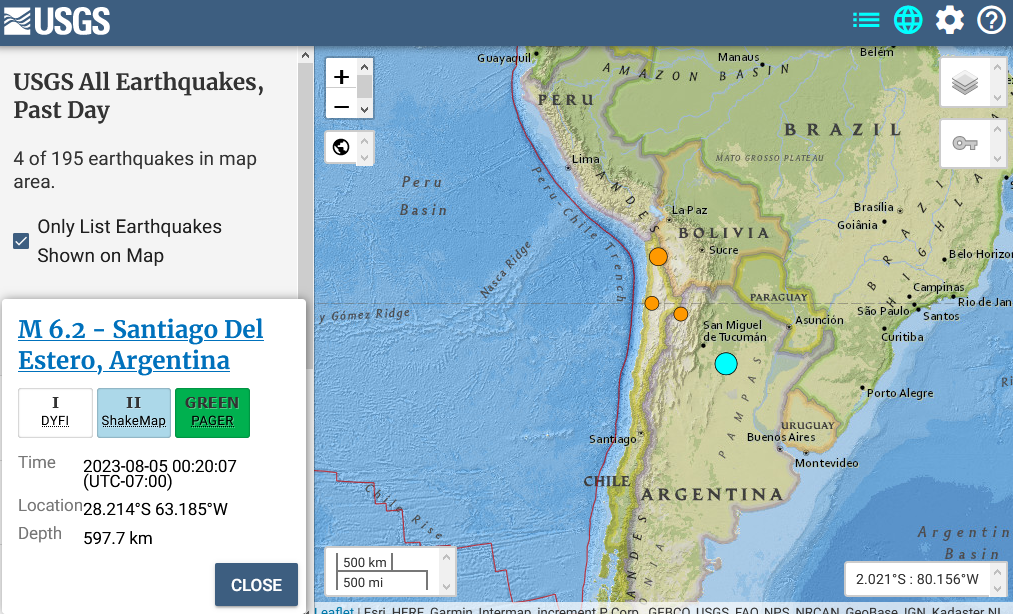
8/5/23 – 195 Earthquakes Worldwide Today
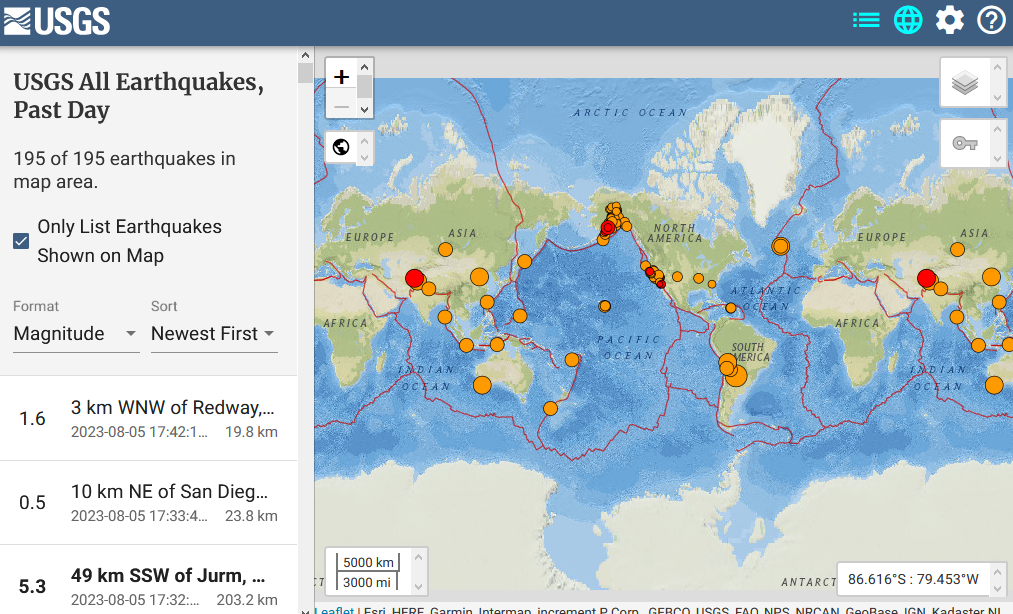
M 6.2 – Santiago Del Estero, Argentina
- 2023-08-05 07:20:07 (UTC)
- 28.214°S 63.185°W
- 597.7 km depth
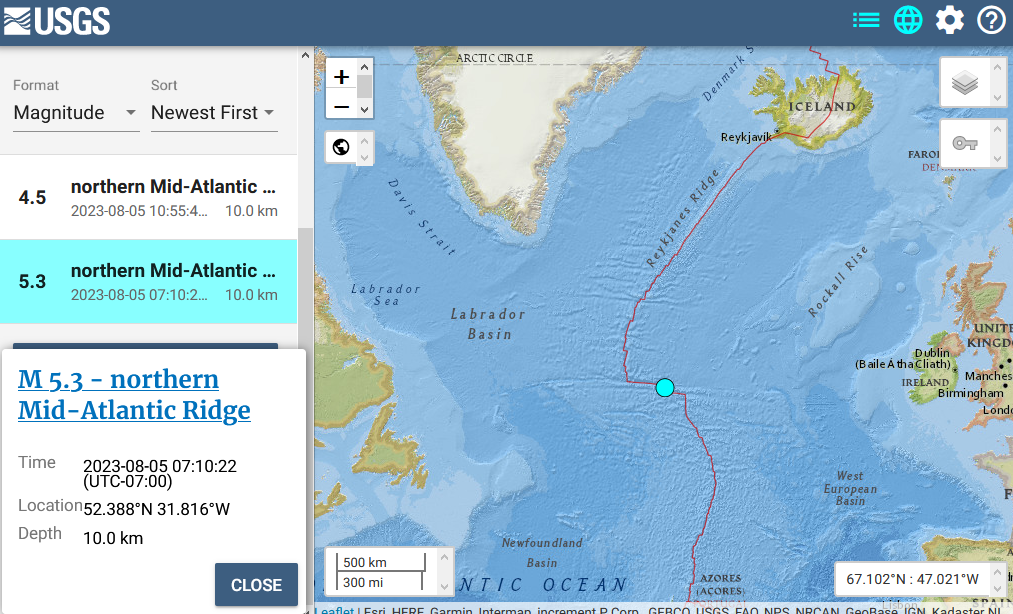
M 5.3 – northern Mid-Atlantic Ridge
- 2023-08-05 14:10:22 (UTC)
- 52.388°N 31.816°W
- 10.0 km depth
M 4.5 – northern Mid-Atlantic Ridge
- 2023-08-05 17:55:42 (UTC)
- 52.414°N 31.758°W
- 10.0 km depth
8/5/23 – Methane Report for CAMS & NOAA Data for Friday, 8/4/23
Margo also reads 1 Kings Chapter 15.
8/6/23 – Methane, Sea Ice & Climate Weekly Roundup with Margo (Aug. 6, 2023)
Margo reviews methane data from CAMS & NOAA for Saturday, 8/5/23. She also shows the current state of the Arctic and Antarctic sea ice and looks at Climate Reanalyzer and earthquakes. Margo also shares a recent post from Robin Westenra on the Hunga Tonga volcano. Margo also reads Tobit Chapter 1.
Show Links:
https://seaice.uni-bremen.de/data/smos_smap/png/north/2023/
https://seemorerocks.is/the-role-of-the-tongan-eruption-on-global-warming/
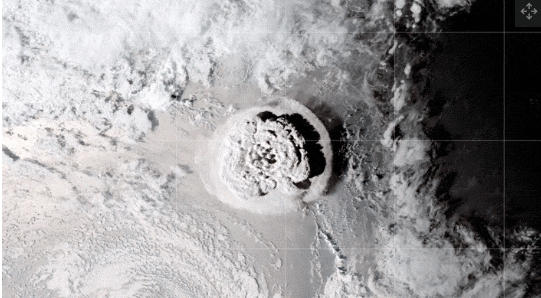
8/7/23 – from Robin Westenra regarding the Hunga Tonga Volcano eruption in Jan. 2022:
This information is being ACTIVELY SUPPRESSED in New Zealand – Record Global Temperatures Driven by Hunga-Tonga Volcanic Water Vapor
“The eruption of the submarine Hunga volcano in January 2022 was associated with a powerful blast that injected volcanic material to altitudes up to 58 km. From a combination of various types of satellite and ground-based observations supported by transport modeling, we show evidence for an unprecedented increase in the global stratospheric water mass by 13% as compared to climatological levels, and a 5-fold increase of stratospheric aerosol load, the highest in the last three decades.”
https://seemorerocks.is/the-role-of-the-tongan-eruption-on-global-warming/
8/7/23 – Jim Massa’s new video on warming oceans:
Past and Future Ocean Warming Trends
8/8/23 – Methane Report for CAMS Data for Sunday, 8/6/23
8/8/23 – Methane Report for CAMS & NOAA Data for Monday, 8/7/23 & Other Updates
Margo also reads 1 Kings Chapter 16.
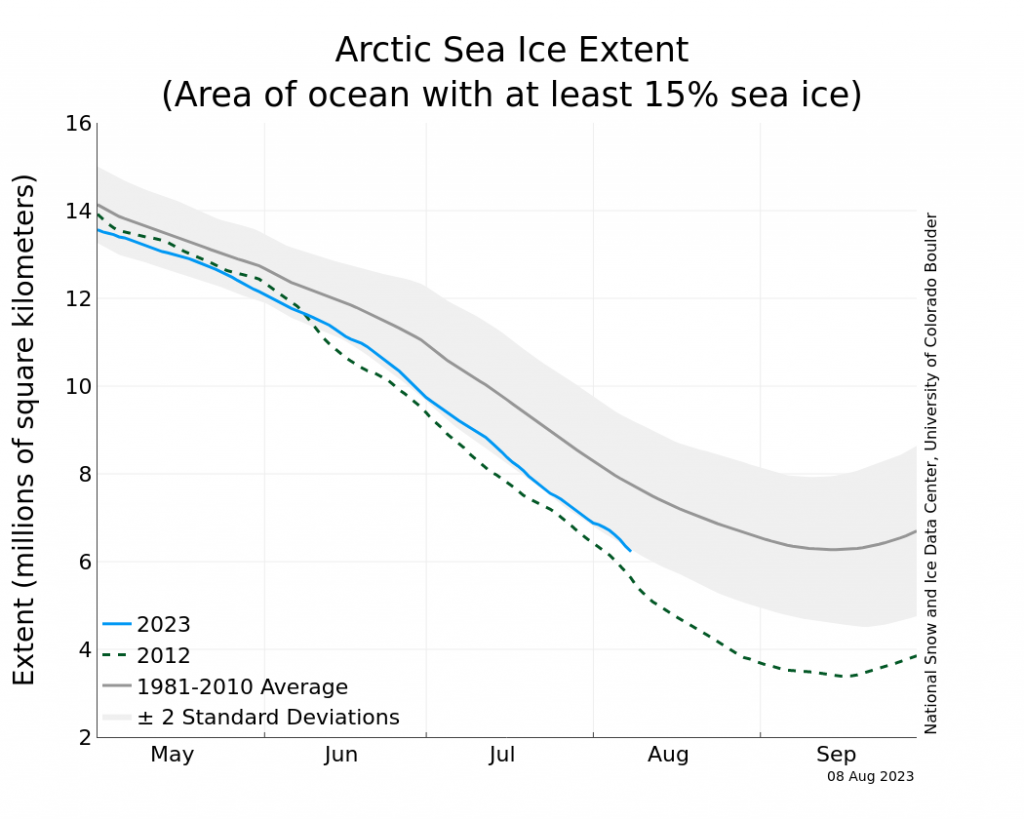
8/9/23 – Here’s the latest from Sam Carana:
Arctic sea ice August 2023
Arctic Ocean heating up
http://arctic-news.blogspot.com/2023/08/arctic-sea-ice-august-2023.html
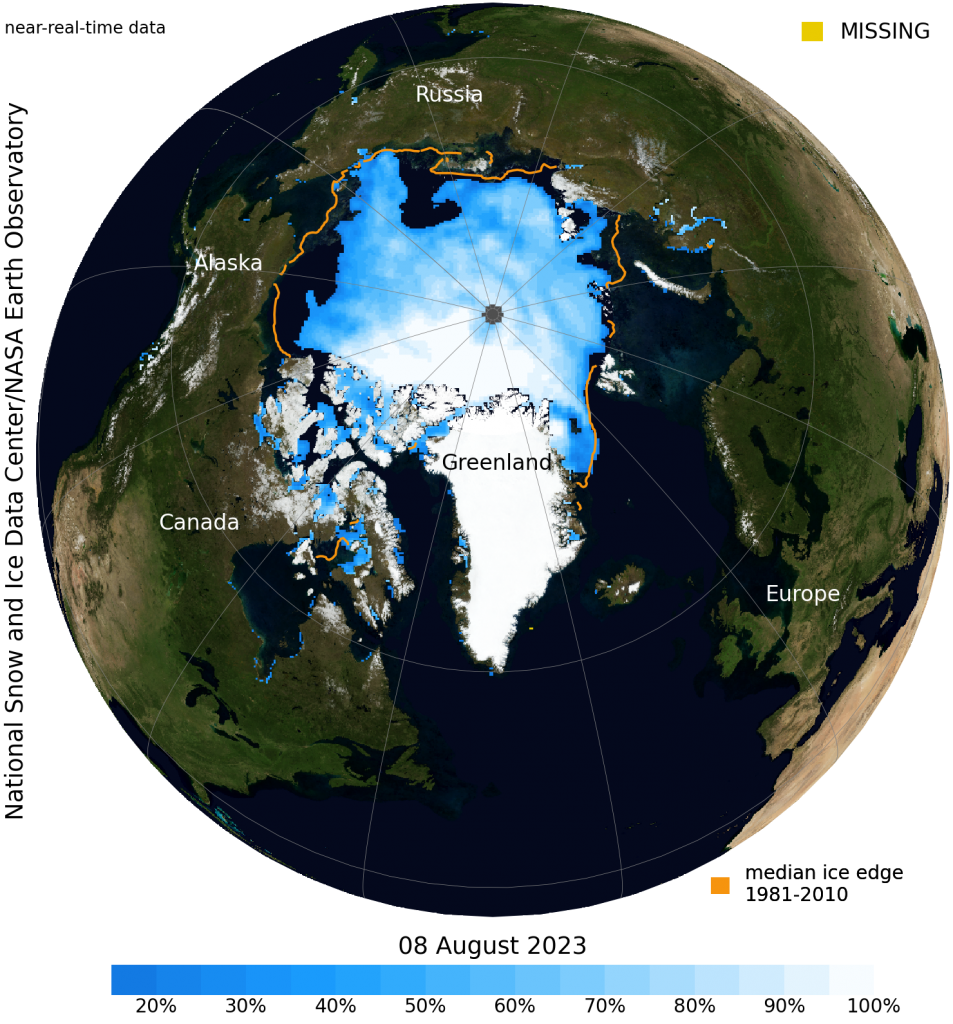
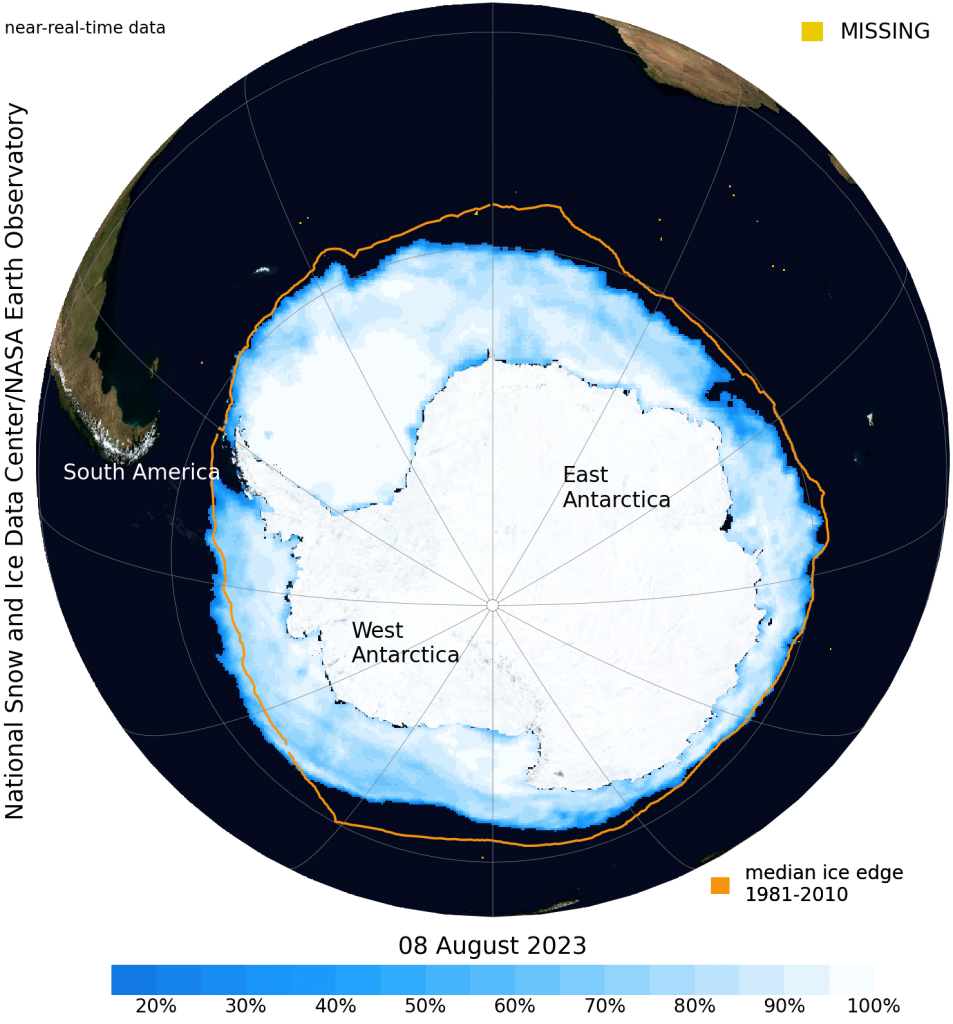
8/9/23 – NSIDC Arctic & Antarctic Sea Ice as of 8/8/23
8/9/23 – Here are the latest Arctic & Antarctic Sea Ice Thickness models from the U.S. Navy

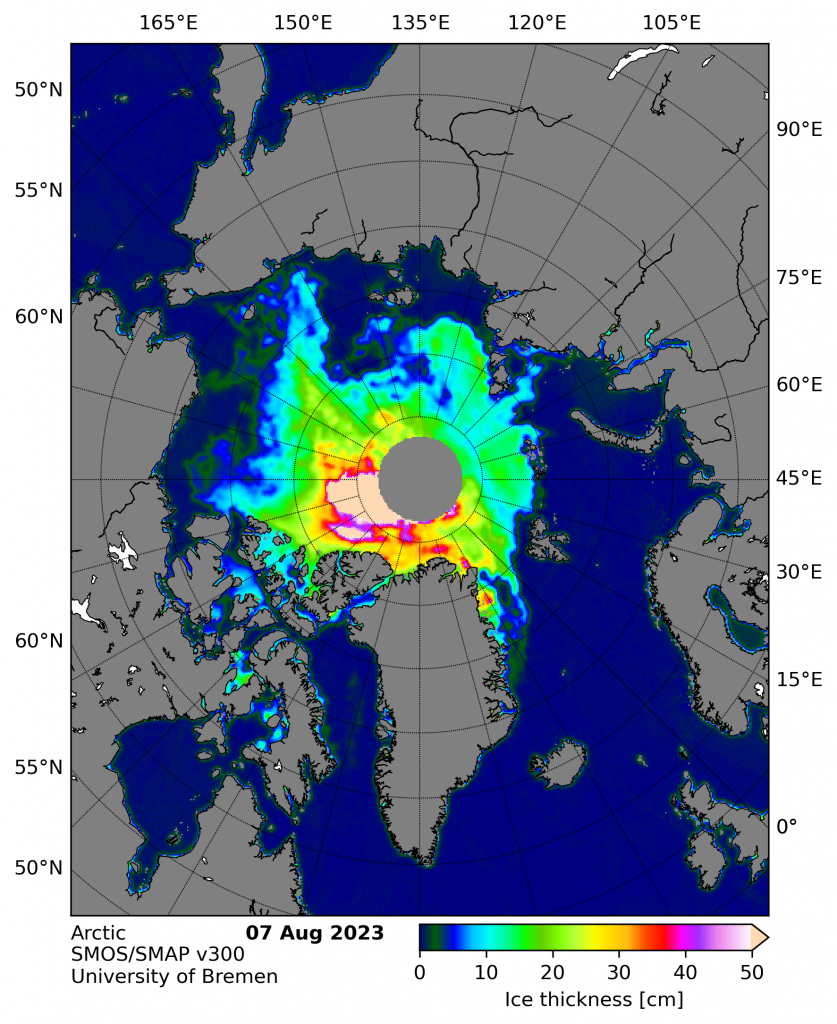
8/8/23 – Bremen Arctic Sea Ice Thickness as of 8/7/23
8/9/23 – Here’s the latest Arctic Data from Climate Reanalyzer

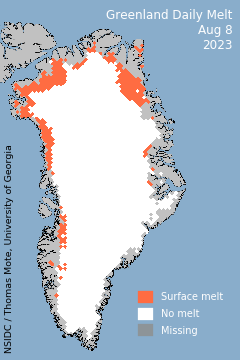
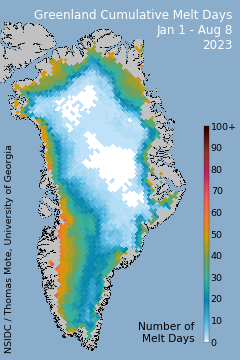
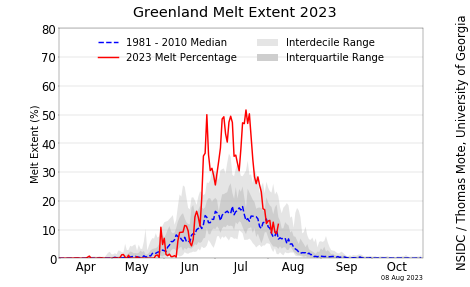
8/9/23 – NSIDC Greenland Ice Sheet Melt for 8/8/23
8/9/23 – Methane Report for CAMS & NOAA Data for Tuesday, 8/8/23 & Mid-Week Update
Margo also reads 1 Kings Chapter 17.
Show Link:
http://arctic-news.blogspot.com/2023/08/arctic-sea-ice-august-2023.html
8/11/23 – Methane Report for CAMS Data for Wednesday, 8/9/23
8/11/23 – Methane Report for CAMS & NOAA Data for Thursday, 8/10/23
Margo also reads 1 Kings Chapter 18.
8/13/23 – Methane Report for CAMS & NOAA Data for Friday, 8/11/23
Margo also reads 1 Kings Chapter 19.
8/13/23 – Methane, Sea Ice & Climate Weekly Roundup with Margo (Aug. 13, 2023)
Margo reviews methane data from CAMS & NOAA for Saturday, 8/12/23. She also shows the current state of the Arctic and Antarctic sea ice and looks at Climate Reanalyzer and earthquakes. Margo also reads Tobit Chapter 2.
8/14/23 – Methane Report for CAMS Data for Sunday, 8/13/23
8/15/23 – Here’s another informative video on Greenland from Jason Box
climate wildcard – Greenland melt lakes
8/15/23 – Methane Report for CAMS & NOAA Data for Monday, 8/14/23 & Other Updates
Margo also reads 1 Kings Chapter 20.
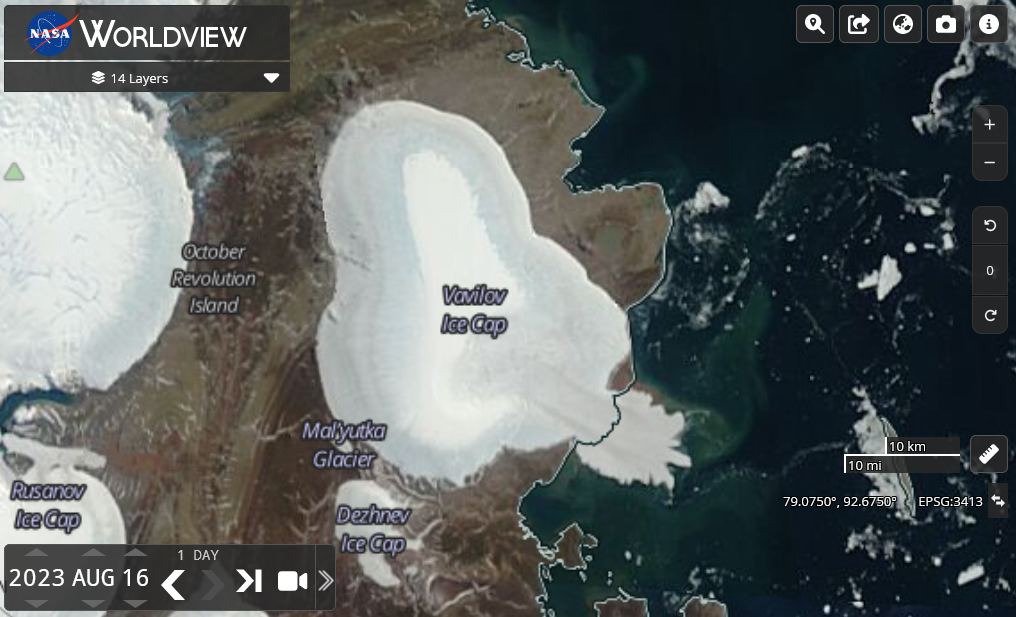
8/16/23 – Here’s a stunning view of the Vavilov Ice Cap today, flowing into the Kara Sea.
8/16/23 – Regarding the University of Bremen Thin Sea Ice Thickness model
“Thin sea ice occurs during the freezing season. In the melting season, the thickness of sea ice is highly variable and the emission properties in the microwave change due to the wetness of the surface and occurrence of melt ponds in the Arctic. Therefore, thickness data are calculated only during the freezing season, that is from October to April in the Arctic and from March to September in the Antarctic. During the melting season, the procedure does not yield meaningful results.”
https://seaice.uni-bremen.de/thin-ice-thickness/
NOTE: This is the model that Sam Carana uses to show Arctic sea ice thickness during the melting season. Thus it’s not valid. I will not be referring to this model during the melting season any longer. I’ll be discussing this in my show tonight.
8/16/23 – NSIDC Arctic & Antarctic Sea Ice as of 8/15/23

8/16/23 – Here are the latest Arctic & Antarctic Sea Ice Thickness models from the U.S. Navy


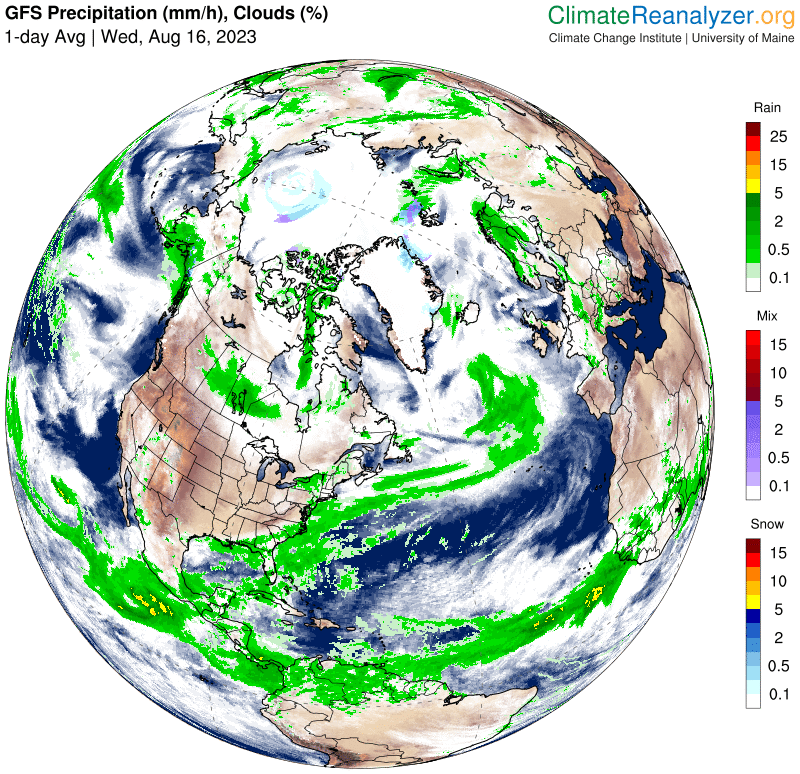
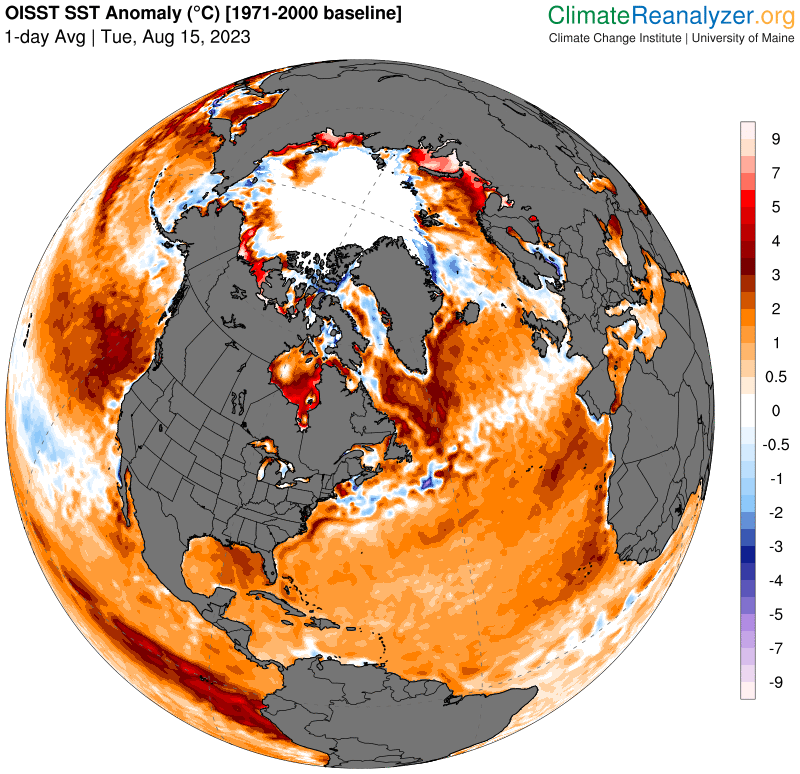
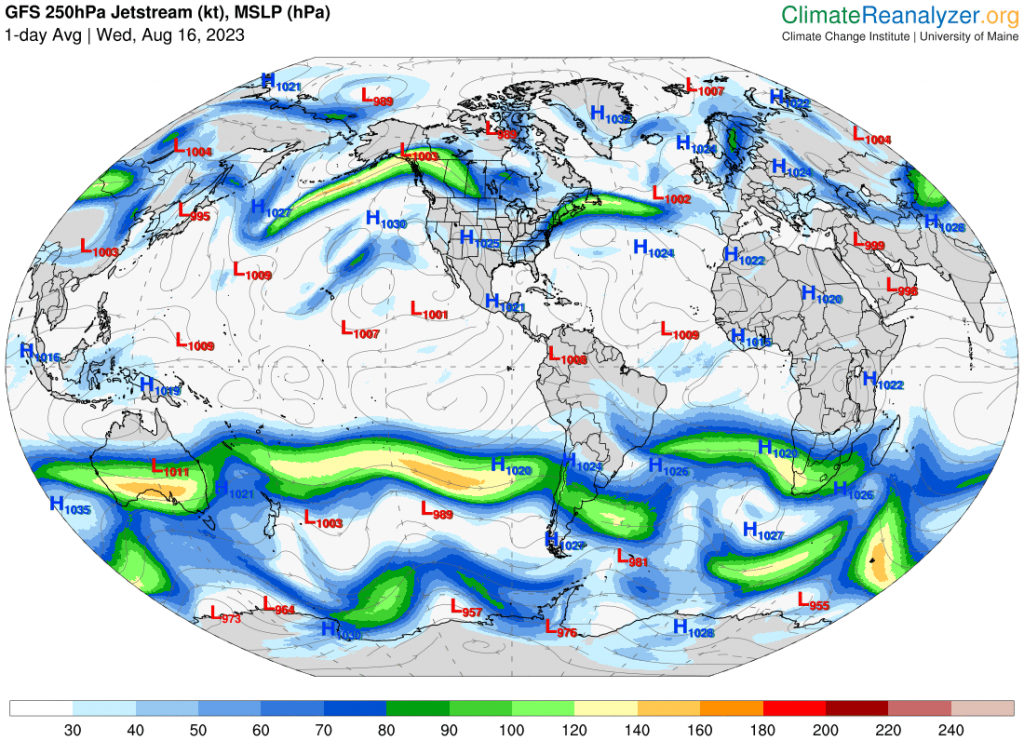
8/16/23 – Here’s the latest Arctic Data from Climate Reanalyzer

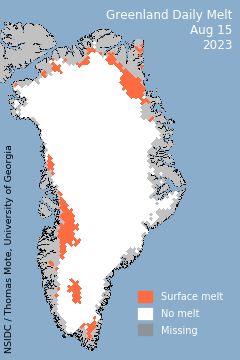
8/16/23 – NSIDC Greenland Ice Sheet Melt for 8/15/23
8/16/23 – Methane Report for CAMS & NOAA Data for Tuesday, 8/15/23 & Mid-Week Update
Margo discusses the University of Bremen’s Thin Sea Ice Thickness model. She also goes over Sam Carana’s latest blog post. Margo also reads 1 Kings Chapter 21.
Show Links:
https://seaice.uni-bremen.de/thin-ice-thickness/
http://arctic-news.blogspot.com/2023/08/two-tipping-points.html
8/17/23 – 231 Earthquakes Worldwide Today
M 6.0 – central Mid-Atlantic Ridge
- 2023-08-17 16:41:02 (UTC)
- 0.306°S 19.571°W
- 10.0 km depth
M 6.3 – 16 km N of Cumaral, Colombia
- 2023-08-17 17:04:49 (UTC)
- 4.418°N 73.511°W
- 10.0 km depth
M 4.1 – 4 km E of Petrolia, CA
- 2023-08-17 21:08:00 (UTC)
- 40.318°N 124.234°W
- 31.9 km depth
8/18/23 – Methane Report for CAMS Data for Wednesday, 8/16/23
8/18/23 – Hurricane Hilary can be tracked on zoom.earth
8/18/23 – Methane Report for CAMS & NOAA Data for Thursday, 8/17/23 & Other Updates
Margo also reads 1 Kings Chapter 22.
8/20/23 – Methane Report for CAMS & NOAA Data for Friday, 8/18/23 & Other Updates
In addition to methane, Margo goes over recent viewer comments and tracks Hilary on Climate Reanalyzer and Zoom Earth. Margo also reads 2 Kings Chapter 1.
8/20/23 – 289 Earthquakes Worldwide Today
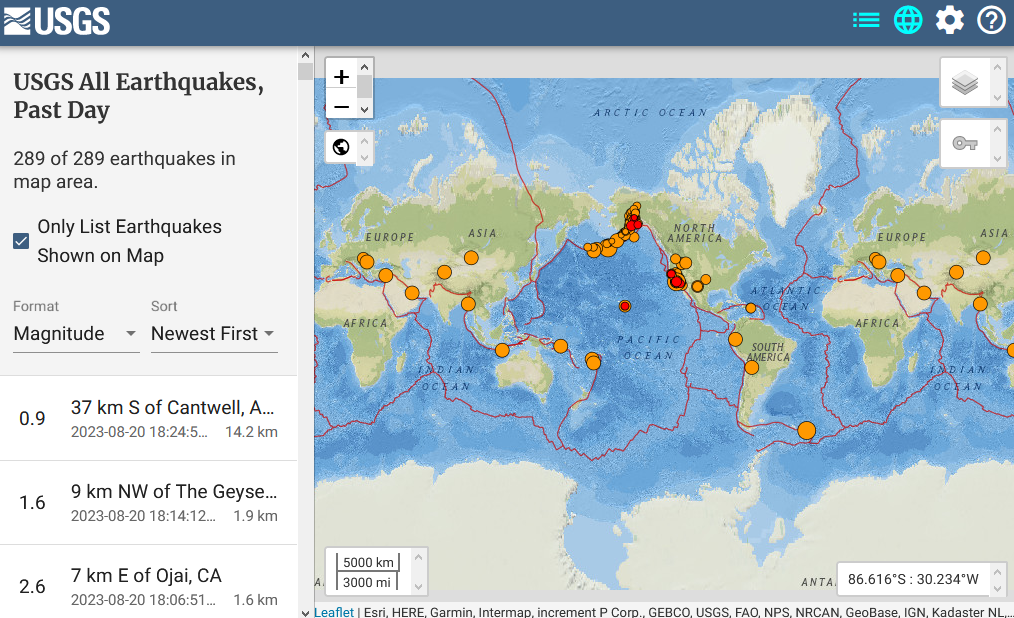
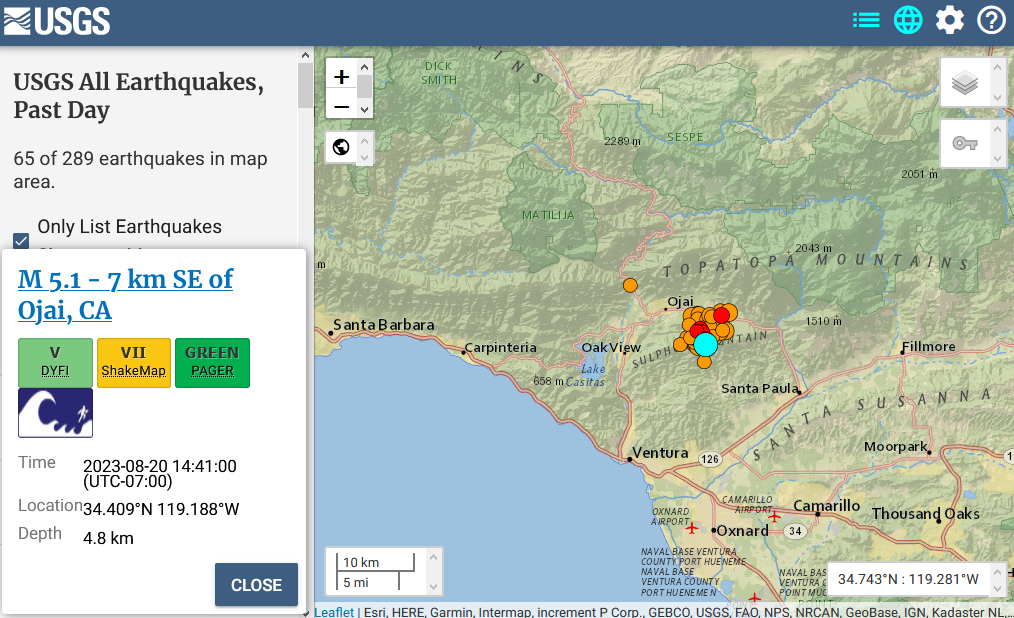
65 EQs Swarming at Ojai, CA
M 5.1 – 7 km SE of Ojai, CA
- 2023-08-20 21:41:00 (UTC)
- 34.409°N 119.188°W
- 4.8 km depth
8/20/23 – Methane, Sea Ice & Climate Weekly Roundup with Margo (Aug. 20, 2023)
Margo reviews methane data from CAMS & NOAA for Saturday, 8/19/23. She also shows the current state of the Arctic and Antarctic sea ice and looks at Climate Reanalyzer and earthquakes. Margo also tracks Tropical Storm Hilary on Climate Reanalyzer and Zoom Earth. Margo also reads Tobit Chapter 3.
Show Link:
https://seaice.uni-bremen.de/thin-ice-thickness/
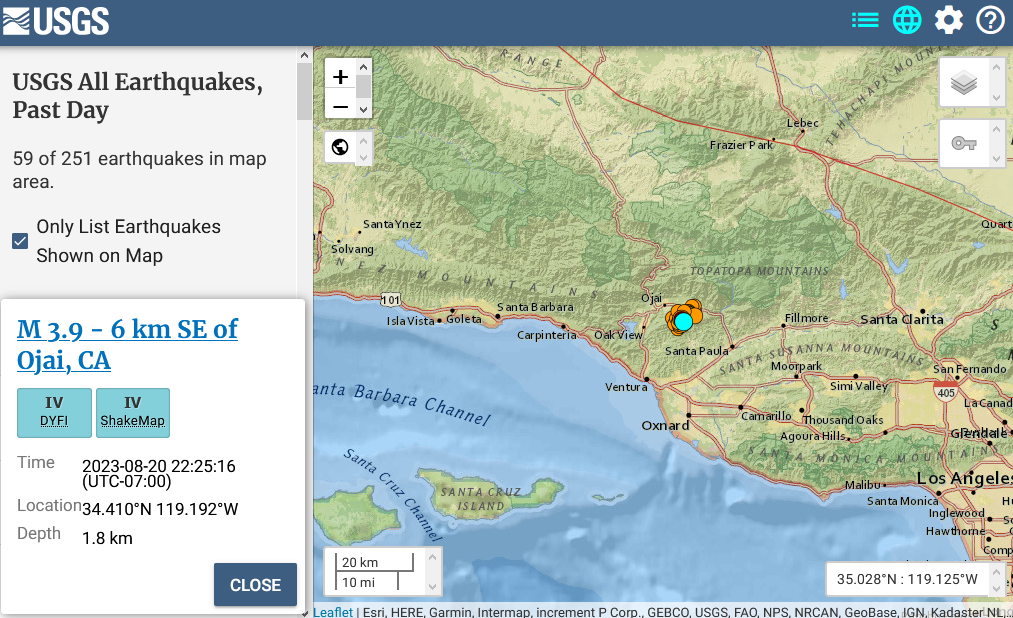
8/21/23 – 251 Earthquakes Worldwide Today
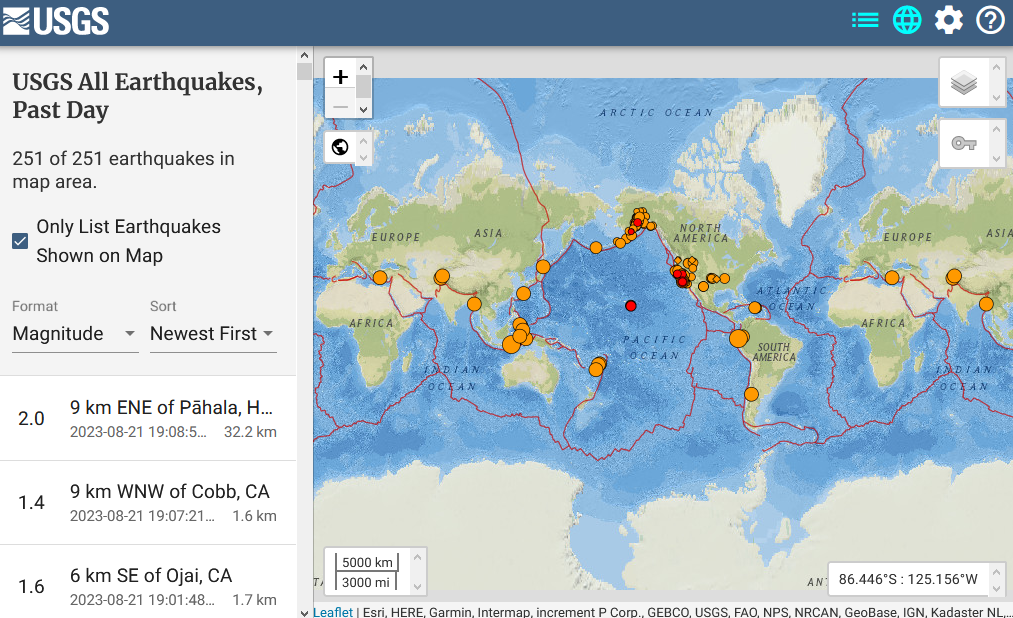
59 EQs at Ojai, CA
M 3.9 – 6 km SE of Ojai, CA
- 2023-08-21 05:25:16 (UTC)
- 34.410°N 119.192°W
- 1.8 km depth
8/22/23 – Methane Report for CAMS Data for Sunday, 8/20/23
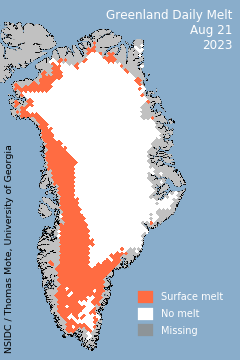
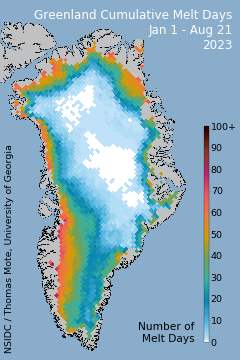
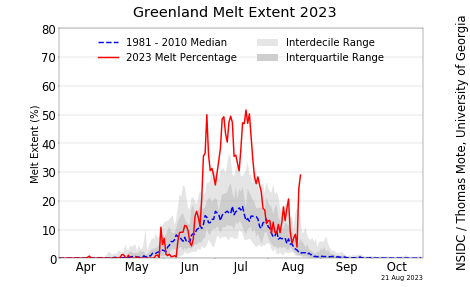
8/22/23 – Greenland melting was near 30% yesterday
8/22/23 – Methane Report for CAMS & NOAA Data for Monday, 8/21/23 & Other Updates
Margo also reads 2 Kings Chapter 2.
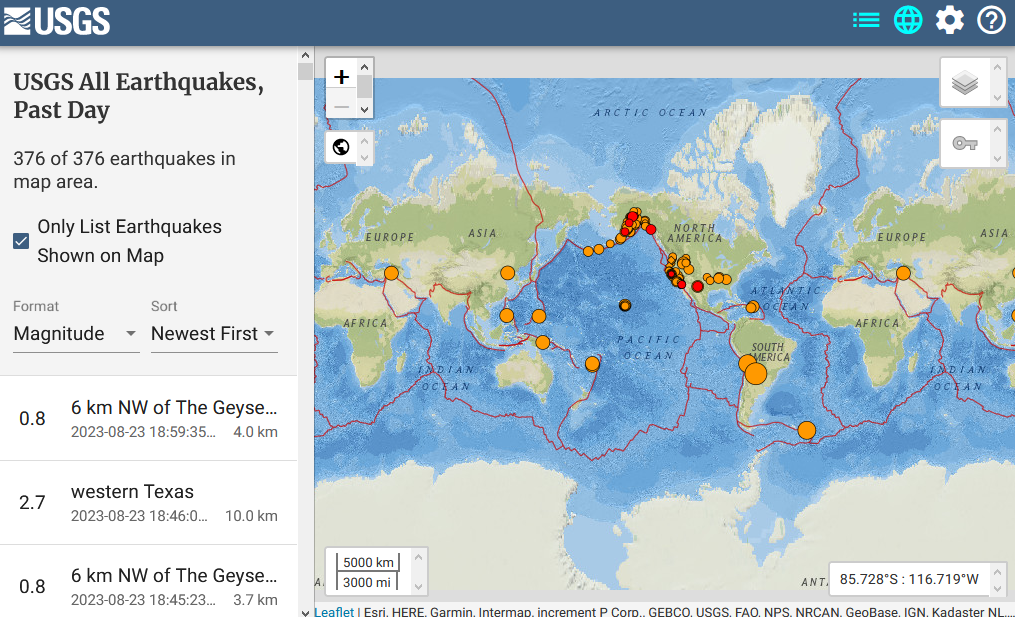
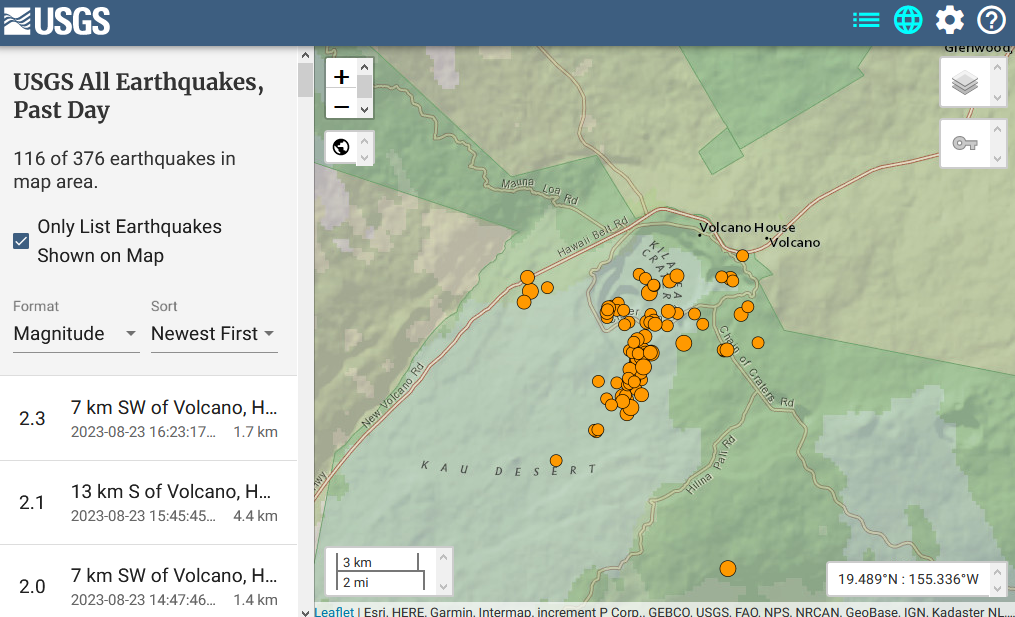
8/23/23 – 376 Earthquakes Worldwide Today
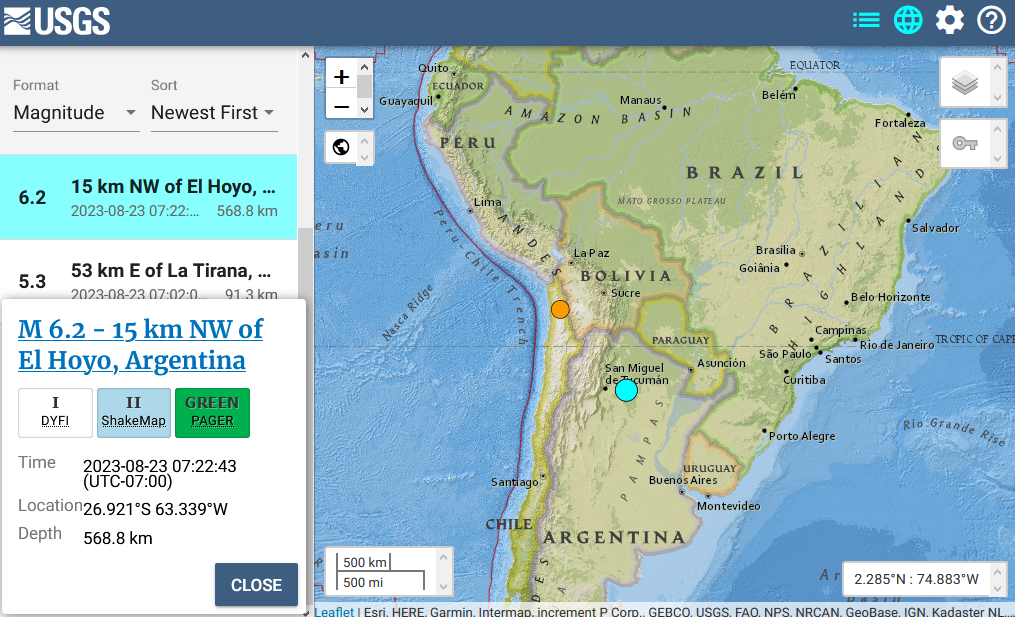
M 6.2 – 15 km NW of El Hoyo, Argentina
- 2023-08-23 14:22:43 (UTC)
- 26.921°S 63.339°W
- 568.8 km depth
131 EQs swarming at Hawaii
M 3.2 – 21 km SW of Laupāhoehoe, Hawaii
- 2023-08-23 04:54:09 (UTC)
- 19.832°N 155.361°W
- 29.7 km depth
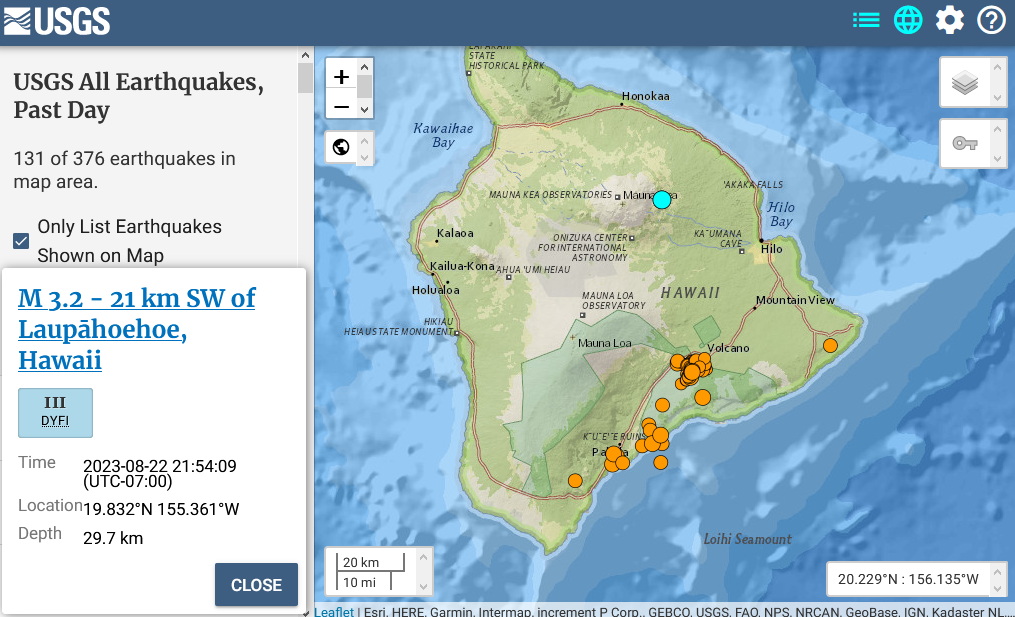
116 EQs swarming at Kilauea Volcano
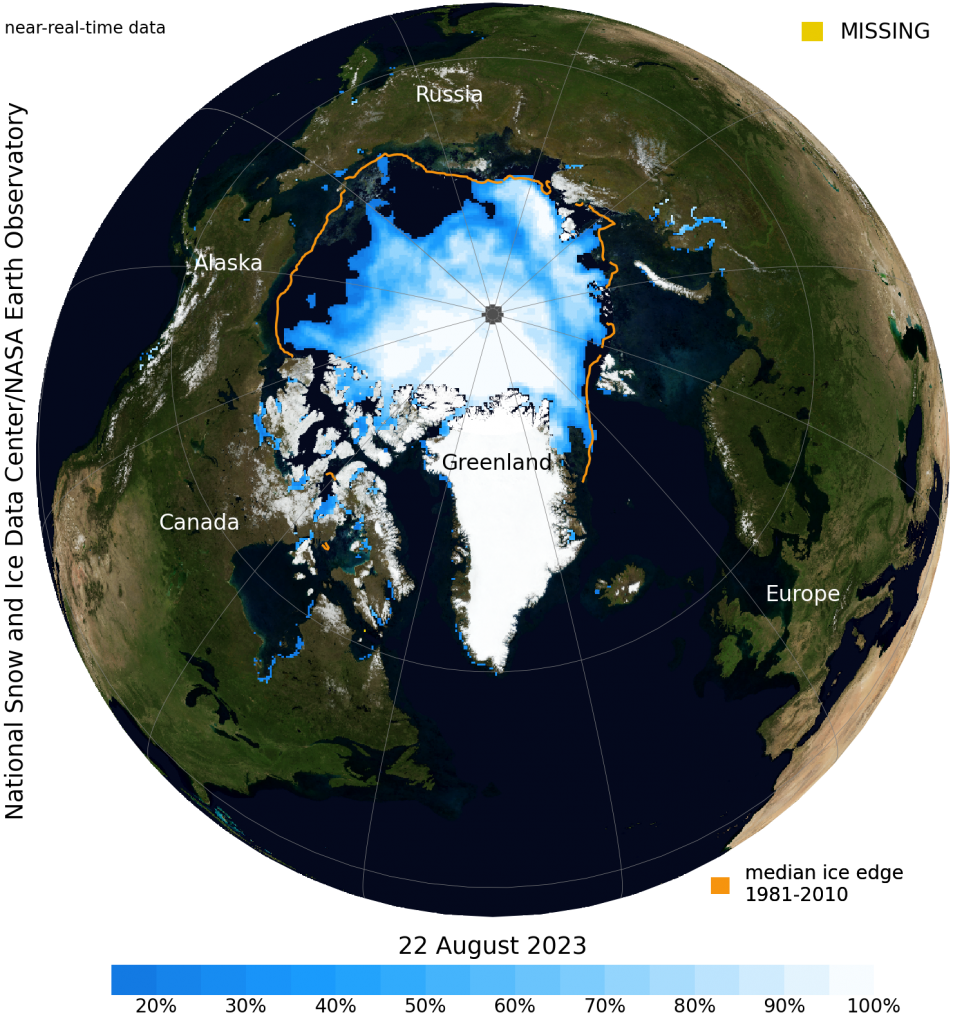
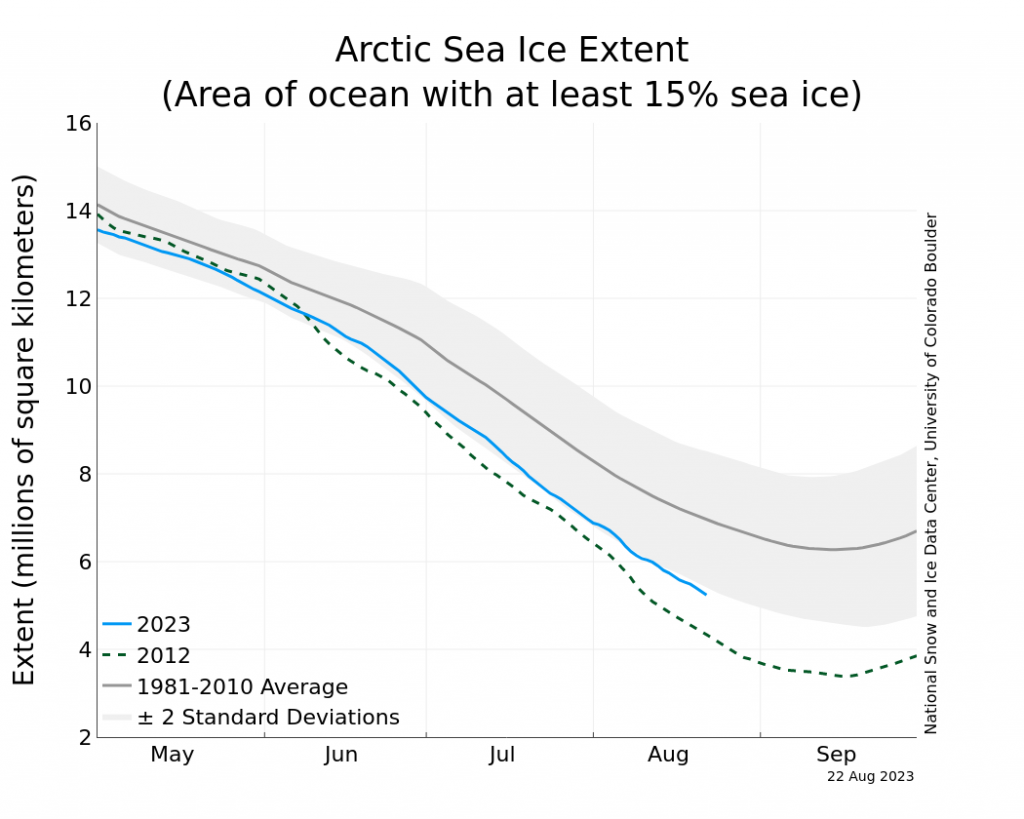
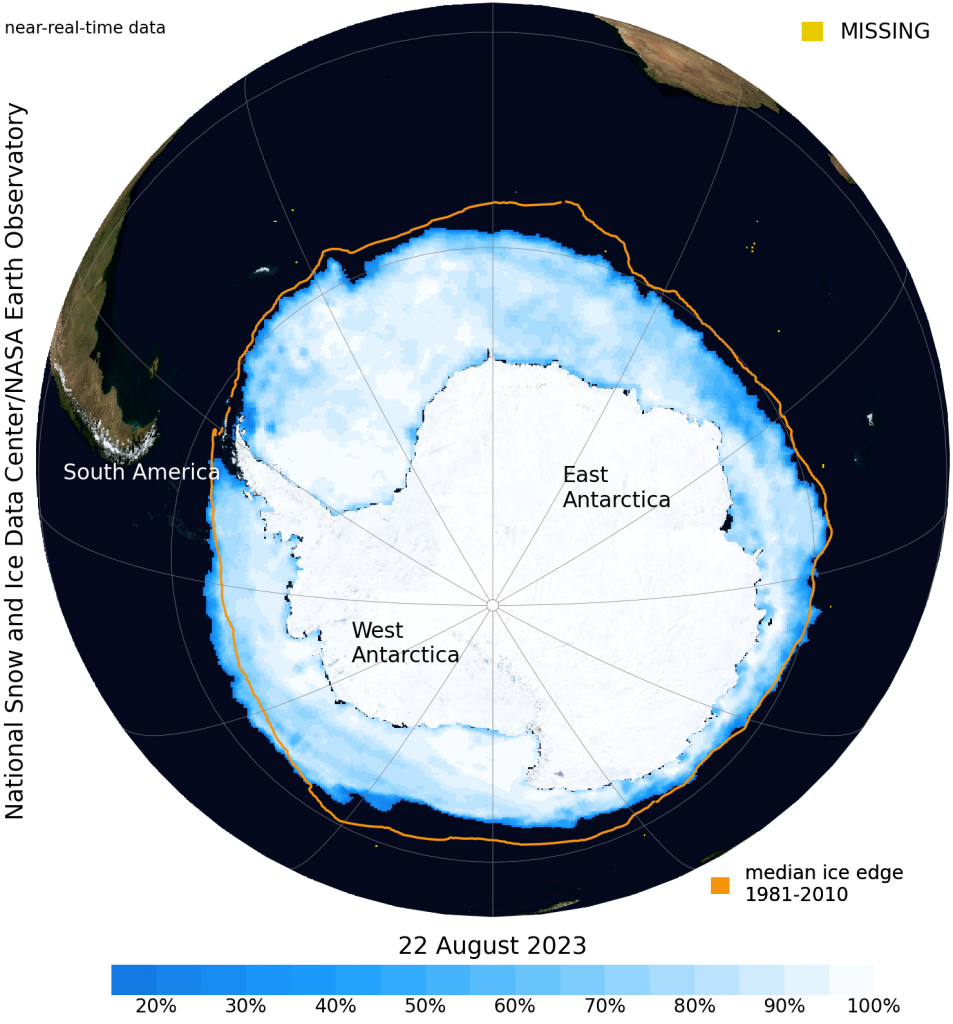
8/23/23 – NSIDC Arctic & Antarctic Sea Ice as of 8/22/23
8/23/23 – Here are the latest Arctic & Antarctic Sea Ice Thickness models from the U.S. Navy
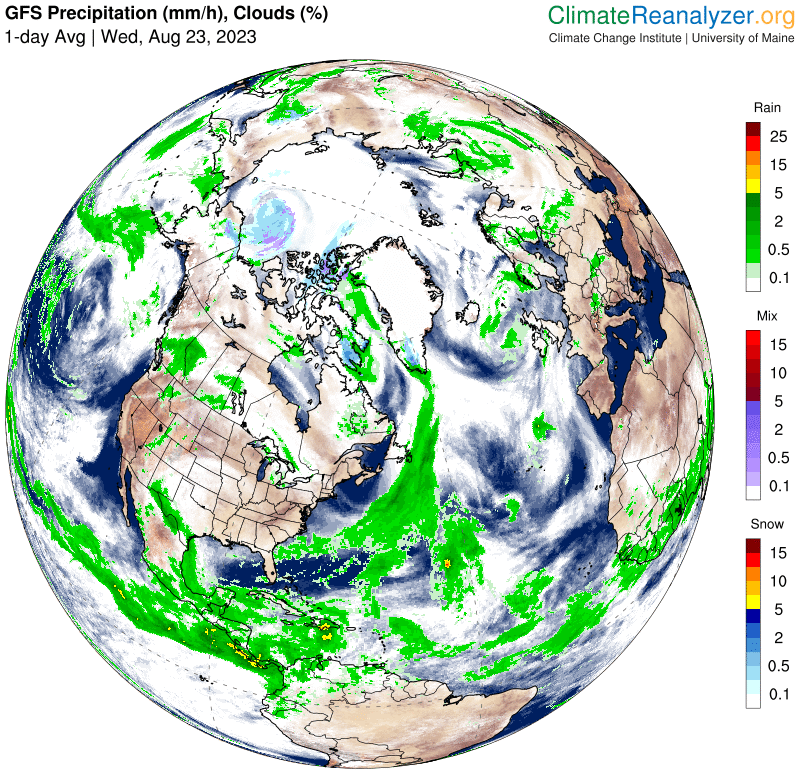
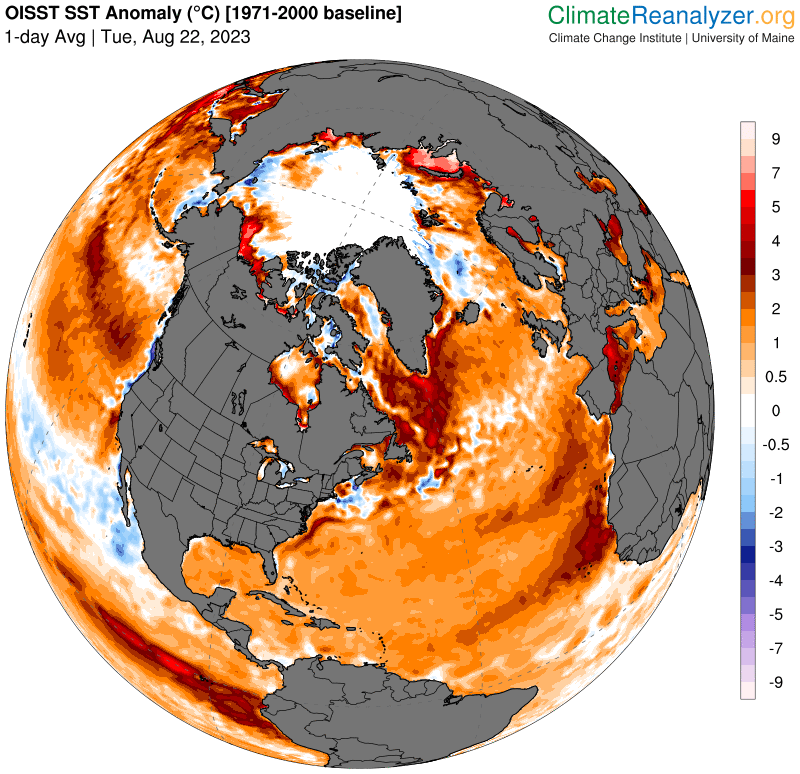
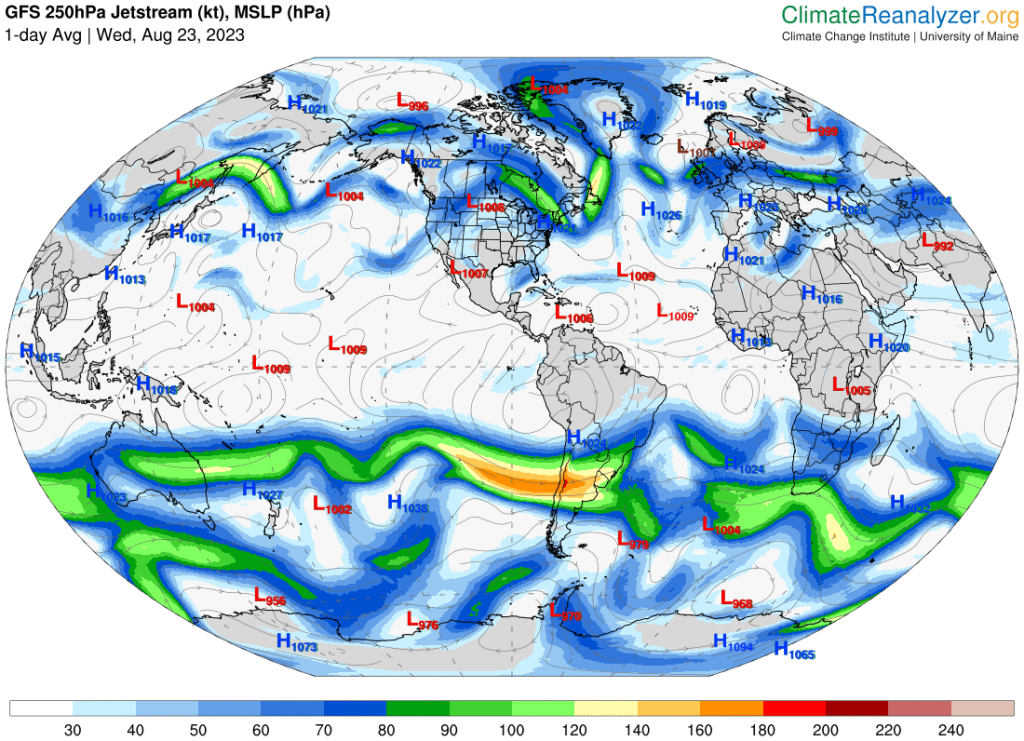
8/23/23 – Here’s the latest Arctic Data from Climate Reanalyzer
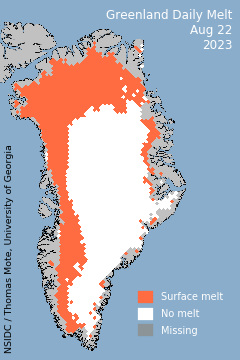
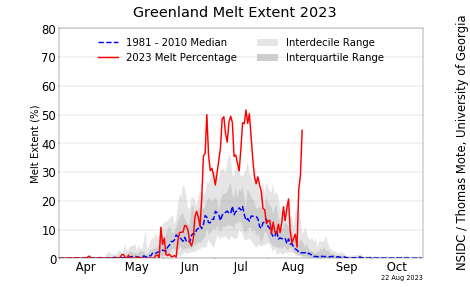
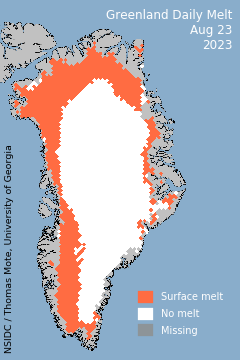
8/23/23 – NSIDC Greenland Ice Sheet Melt spiked to 45% yesterday, 8/22/23

8/23/23 – Methane Report for CAMS & NOAA Data for Tuesday, 8/22/23 & Mid-Week Update
Margo also reads 2 Kings Chapter 3.
8/24/23 – Greenland melting was about 38% yesterday

8/24/23 – Methane Report for CAMS Data for Wednesday, 8/23/23
8/26/23 – Methane Report for CAMS Data for Thursday, 8/24/23
8/26/23 – Methane Report for CAMS & NOAA Data for Friday, 8/25/23
Margo also reads 2 Kings Chapter 4.
8/27/23 – Methane, Sea Ice & Climate Weekly Roundup with Margo (Aug. 27, 2023)
Margo reviews methane data from CAMS & NOAA for Saturday, 8/26/23. She also shows the current state of the Arctic and Antarctic sea ice and looks at Climate Reanalyzer and earthquakes. Margo also reads Tobit Chapter 4.
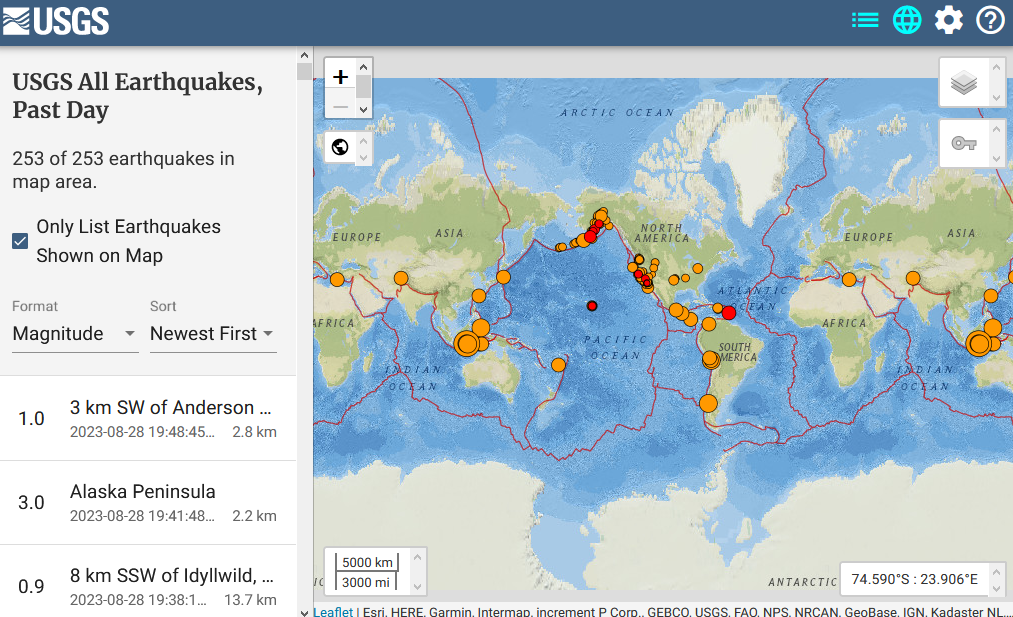
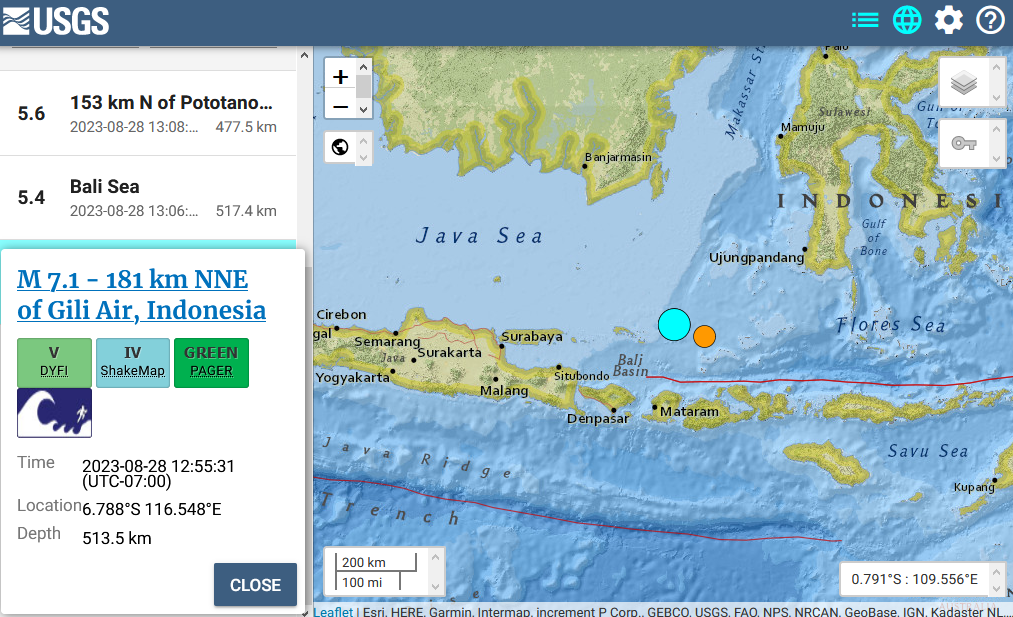
8/28/23 – 253 Earthquakes Worldwide Today
M 7.1 – 181 km NNE of Gili Air, Indonesia
- 2023-08-28 19:55:31 (UTC)
- 6.788°S 116.548°E
- 513.5 km depth
8/28/23 – Methane Report for CAMS Data for Sunday, 8/27/23
8/30/23 – Methane Report for CAMS Data for Monday, 8/28/23
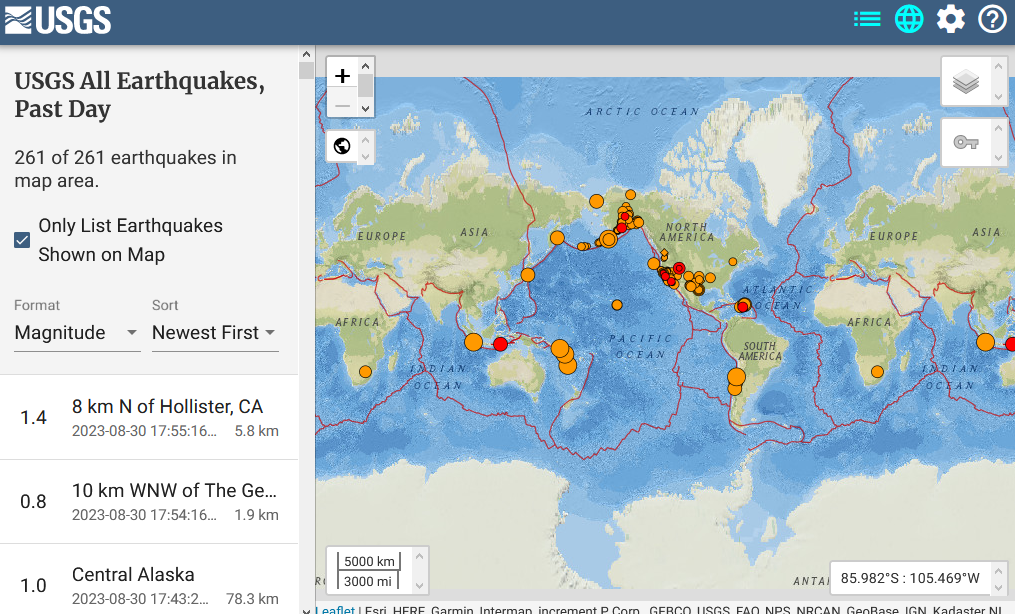
8/30/23 – 261 Earthquakes Worldwide Today
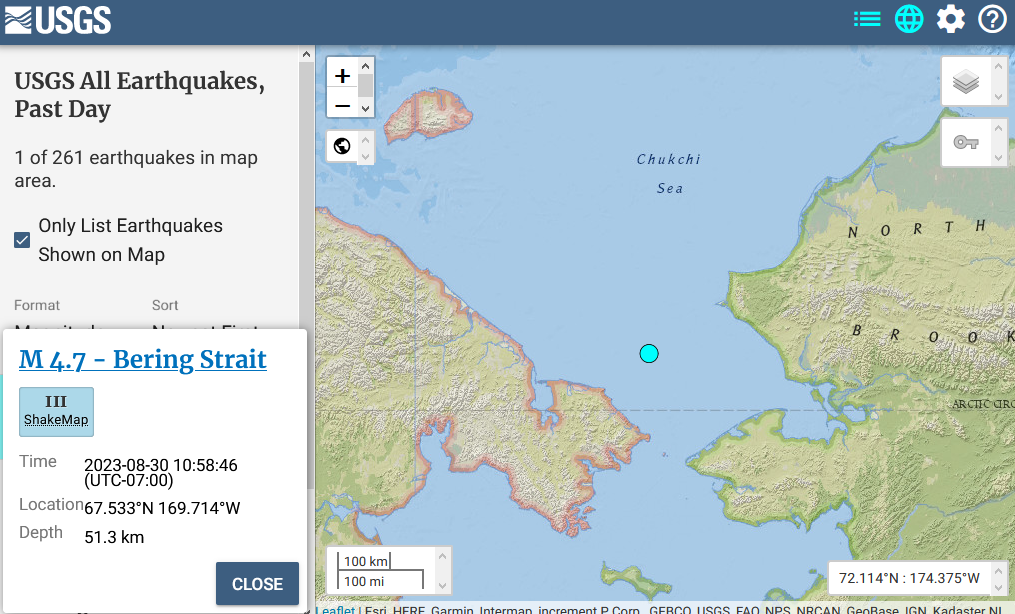
M 4.7 – Bering Strait
- 2023-08-30 17:58:46 (UTC)
- 67.533°N 169.714°W
- 51.3 km depth
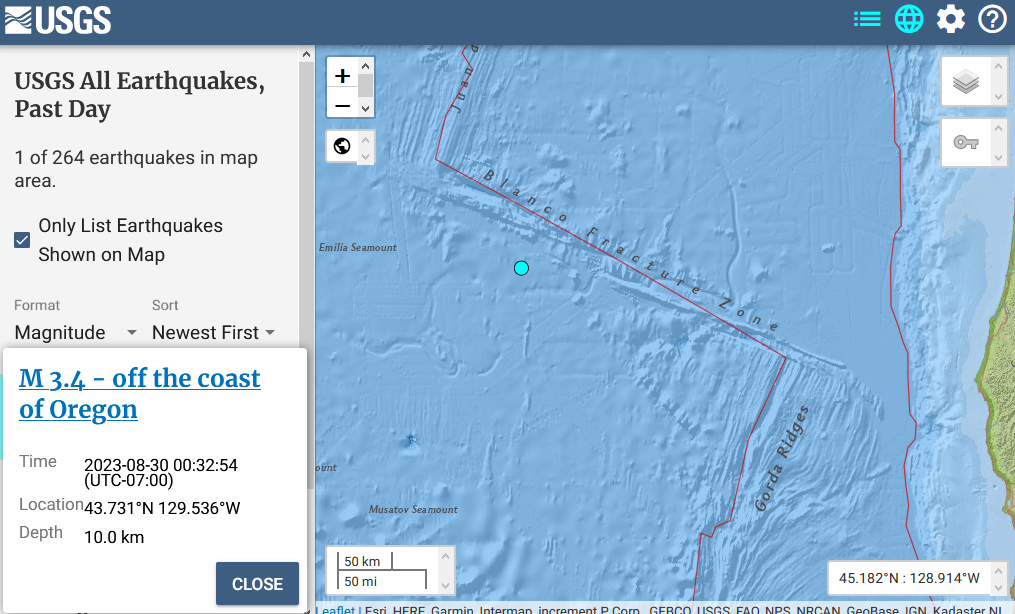
M 3.4 – off the coast of Oregon
- 2023-08-30 07:32:54 (UTC)
- 43.731°N 129.536°W
- 10.0 km depth
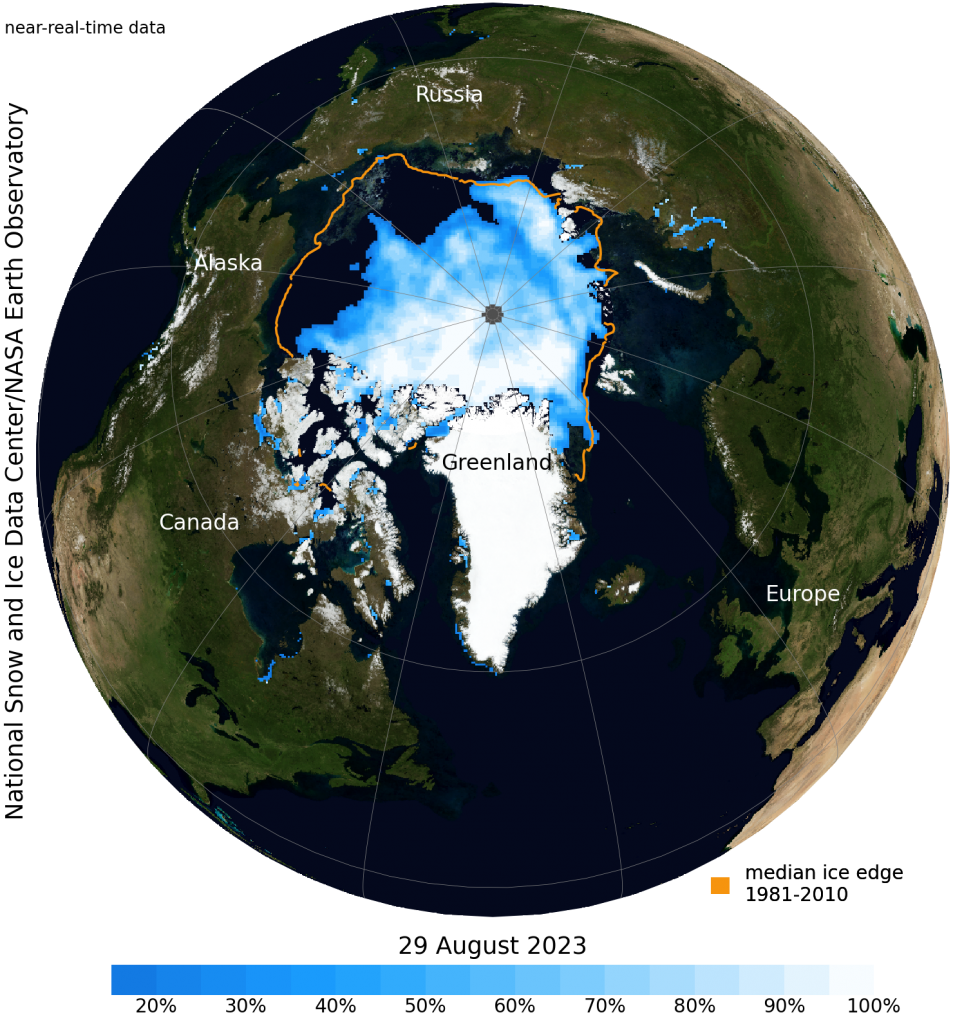
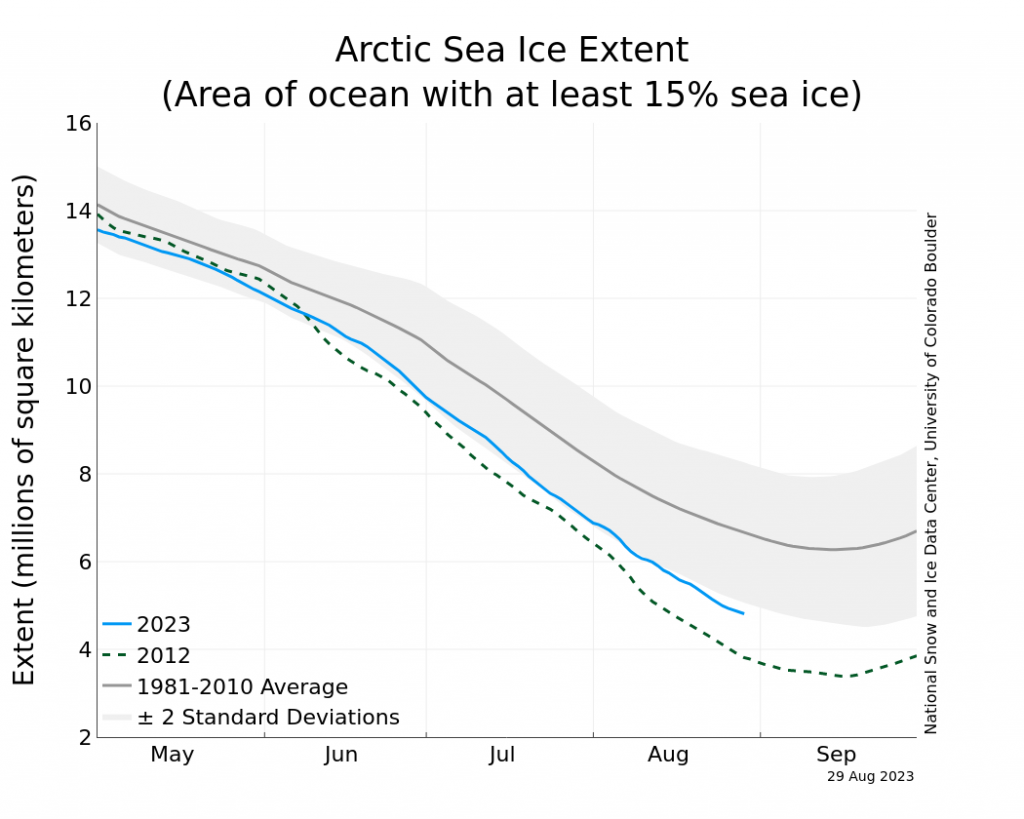
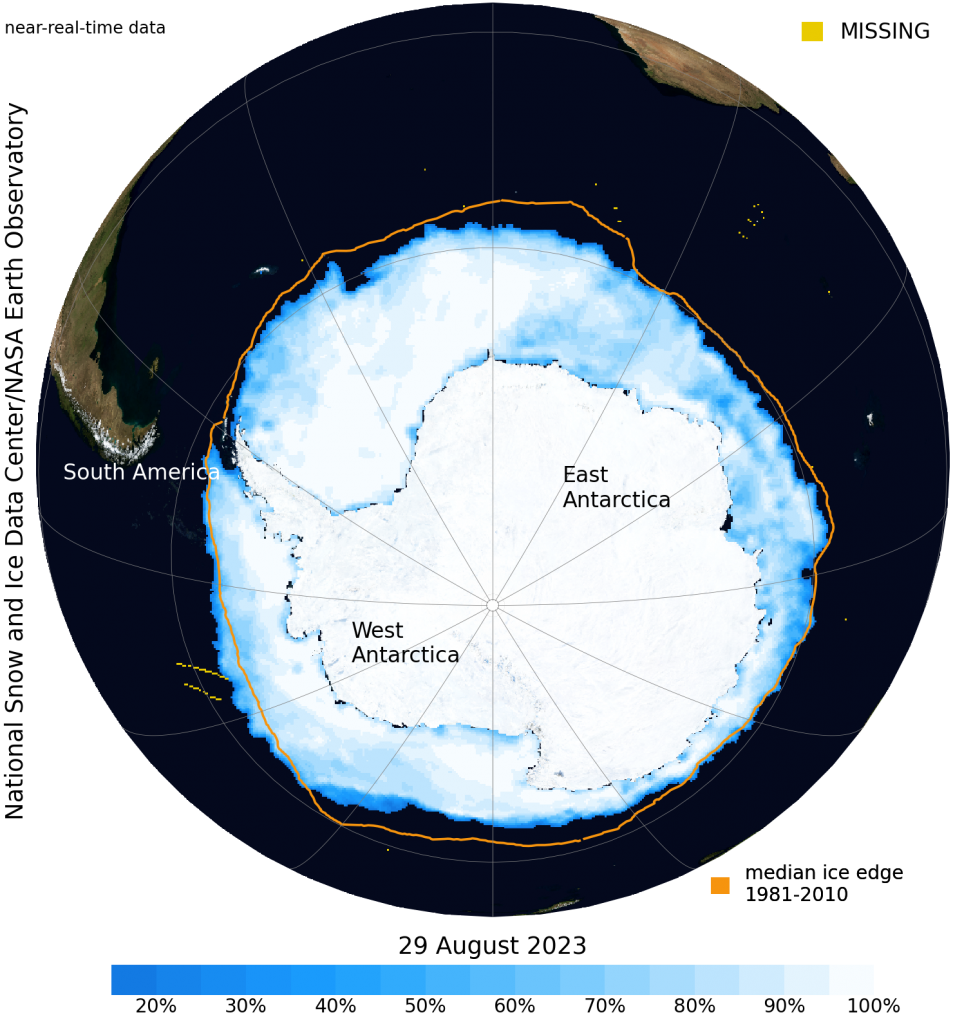
8/30/23 – NSIDC Arctic & Antarctic Sea Ice as of 8/29/23

8/30/23 – Here are the latest Arctic & Antarctic Sea Ice Thickness models from the U.S. Navy


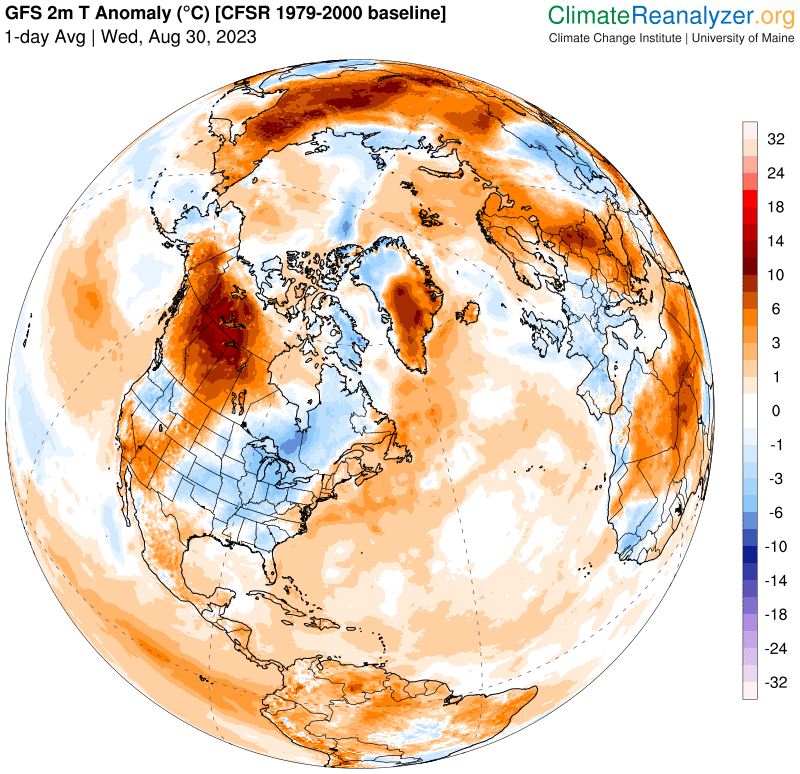
8/30/23 – Here’s the latest Arctic Data from Climate Reanalyzer

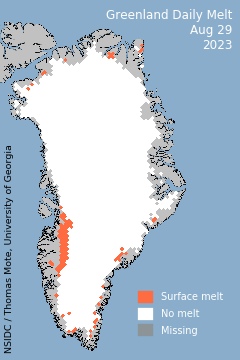
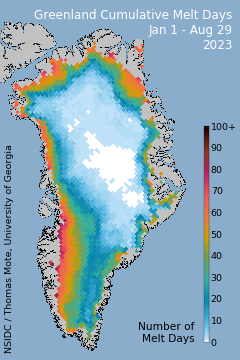
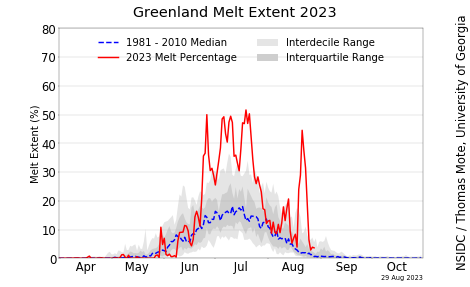
8/30/23 – NSIDC Greenland Ice Sheet Melt for 8/29/23
8/30/23 – Methane Report for CAMS & NOAA Data for Tuesday, 8/29/23 & Mid-Week Update
Margo also reads 2 Kings Chapter 5.
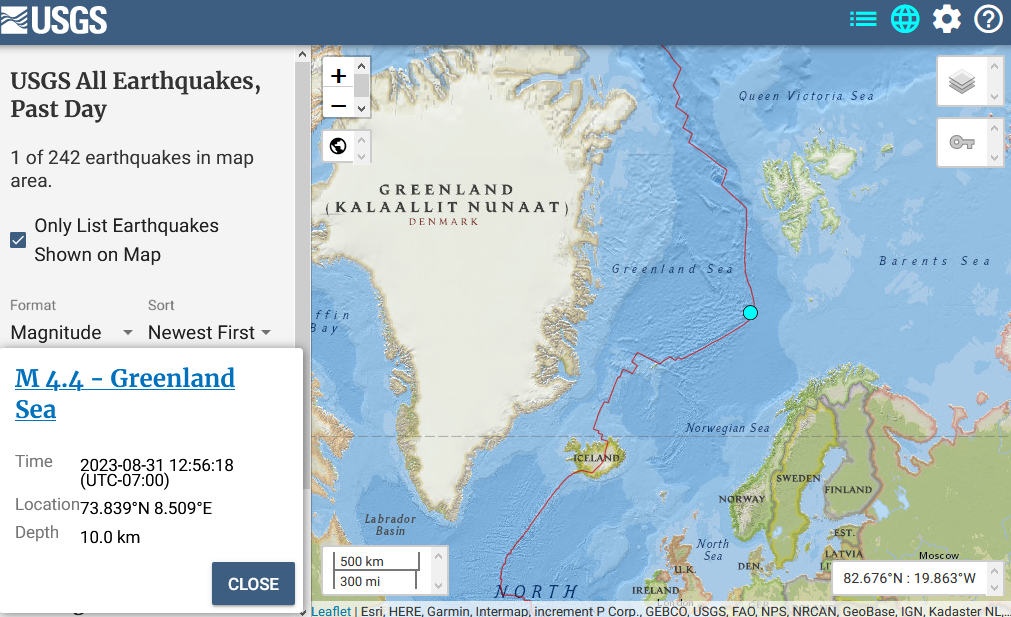
8/31/23 – 242 Earthquakes Worldwide Today
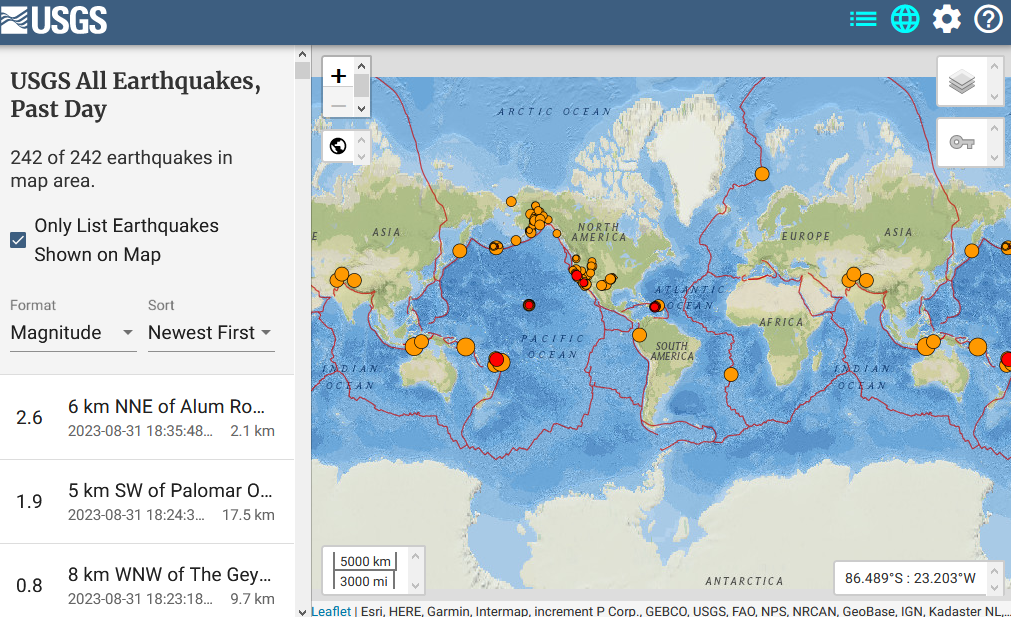
M 4.4 – Greenland Sea
- 2023-08-31 19:56:18 (UTC)
- 73.839°N 8.509°E
- 10.0 km depth
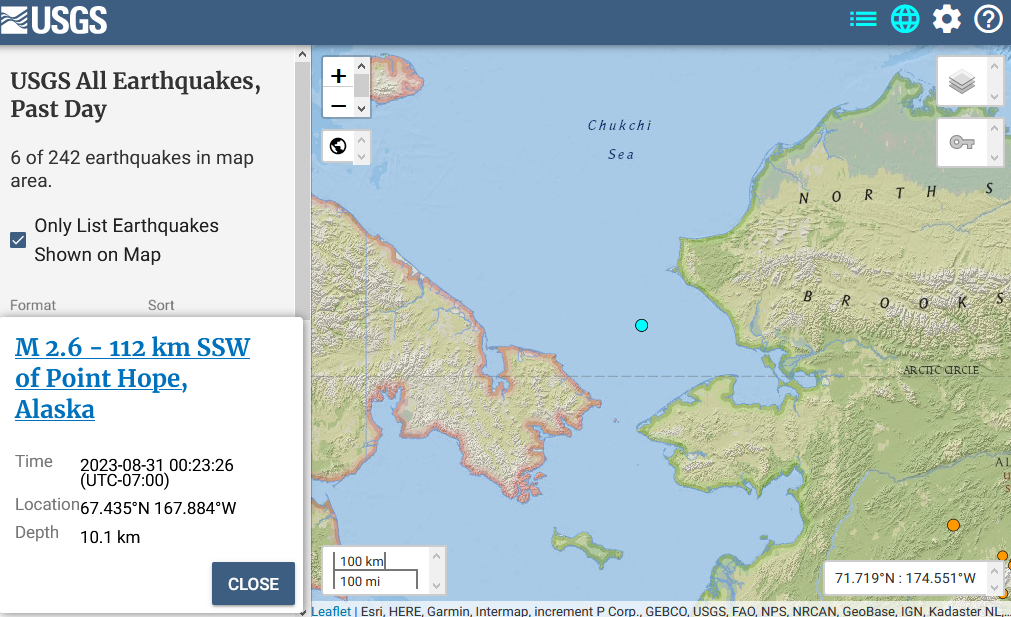
M 2.6 – 112 km SSW of Point Hope, Alaska
- 2023-08-31 07:23:26 (UTC)
- 67.435°N 167.884°W
- 10.1 km depth
8/31/23 – Methane Report for CAMS Data for Wednesday, 8/30/23